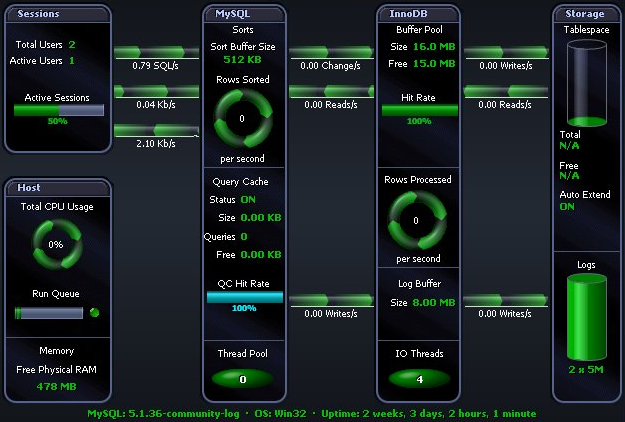
The Spotlight home page shows the flow of information and commands between various sub-components and the size and status of internal resources such as processes, disk files and memory structures.
Related operating system statistics are grouped together on panels that are connected by a series of graphical flows and icons. Spotlight updates these flows in real time so you can see how quickly data is moving through the system. The icons change color as Spotlight alarms are raised, upgraded, downgraded and canceled.
Tip: Hover the mouse pointer over a panel component for more information.
To see the Spotlight on MySQL Home Page
 .
. 
Spotlight alarms indicate when the MySQL database exceeds acceptable performance thresholds.
| Alarm | Description |
|---|---|
| The Buffer Pool Hit Rate alarm fires when the proportion of table data that can be found in the InnoDB buffer pool drops below a specified threshold. | |
| The CPU Busy alarm occurs when the total CPU utilization of the system exceeds a threshold. The CPU may encounter a large number of requests, or you may have un-tuned SQL, which unnecessarily uses excessive amounts of CPU. | |
| The Inefficient Sort alarm fires when the number of temporary files created for sorts is high in comparison to the number of sorts performed. | |
| The Low Free Physical RAM alarm occurs when the server’s available RAM is low. | |
| The Query Cache Hit Rate alarm fires when the proportion of SQL queries that can be found in the MySQL query cache drops below a specified threshold. |
Once a problem is isolated you can display a drilldown page with charts and tables that provide a detailed breakdown of the underlying statistics.
| Drilldown | Click to open | Keyboard Shortcut | Drilldown Pages | Description |
|---|---|---|---|---|
| Top Sessions |  |
CTRL+S | Top Sessions Page |
The pages in the Top Sessions drilldown display information about the users connected to the MySQL database. |
| Activity |  |
CTRL+Y | Summary Page | Mutex Page | Sorts Page | Query Cache Page | Configuration Page | Statistics Page | InnoDB Status Page | Error Log Page | General Log Page | Slow Query Log Page | The pages in the Activity drilldown display details of the activity on the MySQL database. |
| Operating System |  |
CTRL+O | OS Performance Page | OS Processes Page | The pages in the Operating System drilldown display information related to the performance of, and processes on, the operating system where the MySQL server is running. |
| Alarm Log |  |
CTRL+L |
The Alarm Log drilldown displays information on the alarms associated with the MySQL database. Note: The Alarm Log drilldown is common to all Spotlight applications. The alarms are specific to the current Spotlight connection. Spotlight on MySQL Alarms |