サポートと今すぐチャット
サポートとのチャット

Foglight for Sybase 5.7.5.40 - User and Reference Guide

Using Foglight for Sybase
Exploring the Sybase Dashboards About the Sybase_MDA Agent About the Sybase_RS Agent Generating SybaseMDA Reports
Reference About us

Table Performance Tab

Previous Next


Table Performance Tab

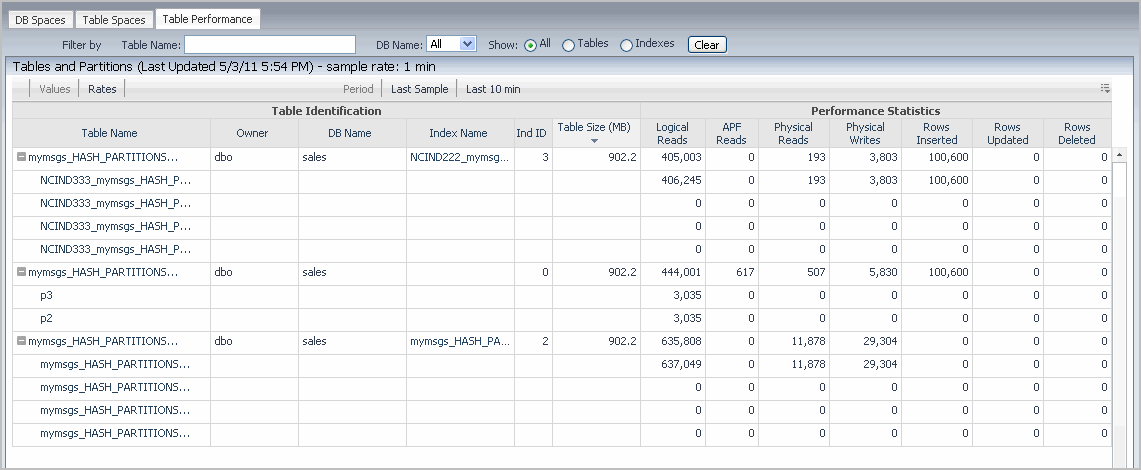
The Table Performance information is provided in a table.

To enable the data collection for a database and to display this data on the Table Performance tab, the database must be added to the Table Space Monitoring list in the Table Space Management group of the Sybase_MDA Agent properties. For more information, see Setting Table Space Management Properties.

Figure 35. Table Performance Tab

Table Performance Filters

The filters appearing just above the table allow you to look for specific entry based on some known criteria. You can filter on table and/or database name, choose between showing the table and/or indices, show delta values or rates, and indicate if you want to display the data collected in the last collection period, most recent sample, or in the last ten minutes.

Table Performance Table

Table 54. Table Performance Table Description

Name

Description

Table Identification

Table Name

For table entries, this column contains the table name. If the table has one or more partition, the table node can be expanded to show the names of table partitions in this column.

For index entries, this column contains the name of the table associated with the index.

When the row shows information about a table, clicking this column shows additional information in the Table Performance Drilldown. For index entries, clicking this column shows the Index Usage Drilldown. Clicking a partition the Partition-Table Usage Drilldown.

Owner

The table owner.

DB Name

The name of the database to which the table belongs.

Index Name

The name of the table index.

Ind ID

For index entries, this column contains the ID of the table index. For table entries, this column shows zero ‘0’. For partitions, this column is blank.

Table Size (MB)

The table size in MB.

Performance Statistics

Logical Reads

The number of buffers read from cache.

APF Reads Delta

The change in the APF reads for the selected period.

Physical Reads Delta

The change in the number of buffers read from disk for the selected period.

Physical Writes

The number of buffers written to disk.

Rows Inserted

The number of inserted rows.

Rows Updated

The number of updated rows.

Rows Deleted

The number of deleted rows.

Table Performance Drilldown

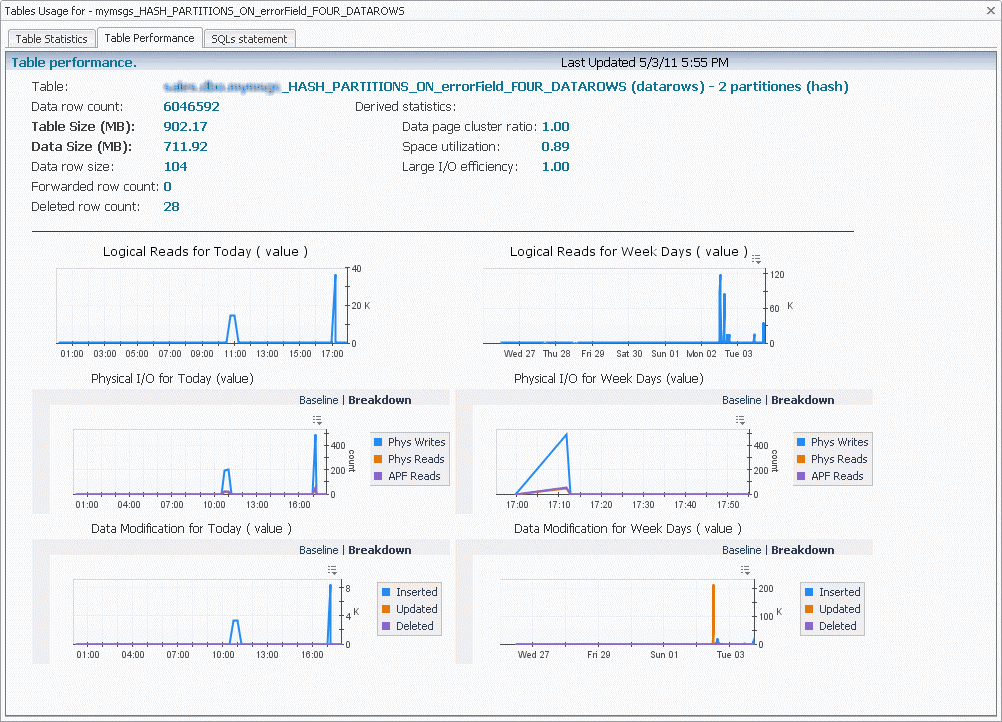
The Table Performance drilldown displays a dialog box with detailed information about the selected table.

Figure 36. Table Performance Drilldown

Table 55. Table Performance Drilldown Description

Name

Description

Table

The table name, its locking schema, and the number of partitions.

Data row count

The number of data rows.

Table Size (MB)

The total table size in MB.

Data Size (MB)

The amount of table space occupied by the data.

Data row size

The data row size.

Forwarded row count

The number of rows forwarded to other pages.

Deleted row count

The number of deleted rows.

Derived statistics

NOTE: This is the same information that can be obtained with the Sybase optdiag utility. For more information about this command, see your Sybase documentation.

Charts

Logical Reads for Today (value)

The amount of data read from cache, shown over the course of the current day.

Physical I/O for Today (value)

The numbers of physical reads, writes, and APF reads, shown over the course of the current day.

Data Modification for Today (value)

Data modification, including the amounts of inserted, updated, and deleted data, shown over the course of the current day.

Logical Reads for Week Days (value)

The amount of data read from cache, shown over the course of the current week.

Physical I/O for Week Days (value)

The numbers of physical reads, writes, and APF reads, shown over the course of the current week.

Data Modification for Week Days (value)

Data modification, including the amounts of inserted, updated, and deleted data, shown over the course of the current week.

Table Rows Total for Today

The count of table rows, shown over the course of the current day.

Table Size for Today

The table size in MB, shown over the course of the current day.

Data Modification Each 1.5 Hours for Today

Data modification, including the amounts of inserted, updated, and deleted data, shown over the course of the current day.

Table Rows Total for Week Days

The number of table rows, shown over the course of the current week.

Table Size for Week Days

The table size in MB, shown over the course of the current week.

Data Modification Each 1.5 Hours for Week Days

Data modification, including the amounts of inserted, updated, and deleted data, shown over the course of the current week.

Index Usage Drilldown

This table displays the same layout and data as the Index Usage Drilldown.

Partition-Table Usage Drilldown

This table displays the same layout and data as the Partition-Table Usage Drilldown.

Top I/O Active Tables

Previous Next


Top I/O Active Tables

Use this dashboard to examine activity of top tables. Tables are displayed based on the sort criteria defined in agent ASP data retrieval. The default order is "Logical Reads". Other criteria possible are:

Top I/O Active Tables Description

Table 56. Top I/O Active Tables Description

Name

Description

Table Name

Name of the table.

DB Name

The name of the database to which the table belongs.

Index Name

The name of the table index.

Ind ID

For index entries, this column contains the ID of the table index. For table entries, this column shows zero '0'. For partitions, this column is blank.

Statistics

Logical Reads

The number of buffers read from cache.

Physical Reads

The number of buffers read from disk.

APF Reads

The number of APF reads.

Physical Writes

The number of buffers written to disk.

Used Count

Number of times the object was used in a plan.

Last Used Date

Last date the index was used in a plan.

Top Lock Activity Tables

Previous Next


Top Lock Activity Tables

Use this tab to examine lock activity of top tables. Tables are displayed based on the sort criteria defined in agent ASP data retrieval. The default order is Logical Reads. Other criteria possible are

Top Lock Activity Table Description

Table 57. Top Lock Activity Table Description

Name

Description

Table Name

Name of the table.

DB Name

The name of the database to which the table belongs.

Index Name

The name of the table index.

Ind ID

For index entries, this column contains the ID of the table index. For table entries, this column shows zero '0'. For partitions, this column is blank.

Row Count

The number of rows in the table.

Lock Scheme

Indicates the locking schema: allpages, datapages, or datarows.

Statistics

Lock Requests

Number of physical locks requested.

Lock Waits

Number of times a task waited for a lock.

Lock Cont Pct.

The percentage of Lock Waits in Requests.

Rows Inserted

The number of rows inserted.

Rows Deleted

The number of rows deleted.

Rows Updated

The number of rows updated.

RS Home Page Dashboard

Previous Next


RS Home Page Dashboard

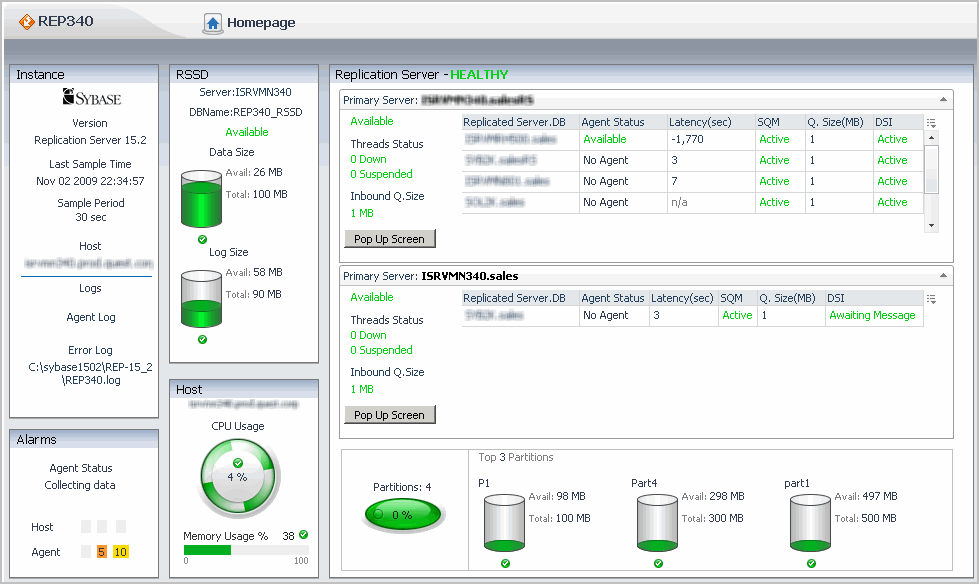
The Replication Server Home Page provides performance details and indicates problems occurring on a specific Replication Server. The following sub-sections describe the dashboard element metrics:

Drilldown dashboards may be accessed through some of the dashboard element metrics. Clicking Rep Server Activity opens the Replication Server Activity Dashboard.

If no data is being collected by the Sybase_RS agent, the “Not Collecting data” error message appears beside the Sybase agent name. In this case, the dashboard shows the data collected from the last sample time.

Figure 37. RS Home Page Dashboard

関連ドキュメント

The document was helpful.

評価を選択

I easily found the information I needed.

評価を選択