サポートと今すぐチャット
サポートとのチャット

Foglight for Sybase 5.7.5.40 - User and Reference Guide

Using Foglight for Sybase
Exploring the Sybase Dashboards About the Sybase_MDA Agent About the Sybase_RS Agent Generating SybaseMDA Reports
Reference About us

Engine Details Tab

Previous Next


Engine Details Tab

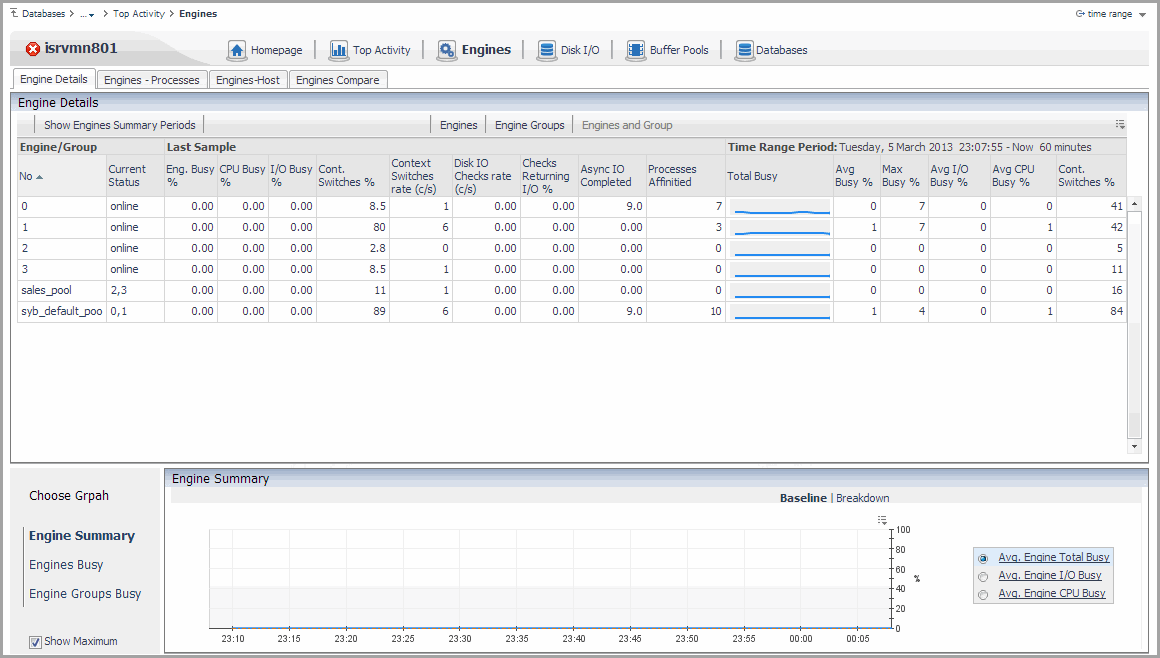
Engine details information is provided in a table and a chart:

Figure 22. Engine Details Tab

Engine Details Table

You can filter the Engine Details table to include:

Table 31. Engine Details Table Description

Name

Description

Engine

No.

The engine number.

Current Status

The current status of the engine: online or offline. Hovering over this value provides more information.

Last Sample

Eng. Busy %

The percentage busy for this engine.

CPU Busy %

The percentage CPU time all engines spent not idle.

I/O Busy %

The percentage of input/output resources currently being used by the database engine.

Cont. Switches %

The percentage of the total number of context switches for the engine divided by those completed for all engines.

Context Switches rate (c/s)

The count of context switches for the engine occurring per second.

Disk IO Checks rate

The number of times the engine checked for asynchronous disk I/O.

Checks Returning I/O %

The percentage of disk I/O checks with I/O pending.

Async IO Completed

The number of times the engine completed I/O.

Processes Affinitied

The number of processes affined with the engine.

Time Range Period

Total Busy

The percentage busy for all of the database engines.

Avg Busy %

The average percentage busy for all of the database engines.

Max Busy %

The maximum percentage busy for all of the database engines.

Avg I/O Busy %

The average percentage of input/output resources currently being used by all of the database engines.

Avg CPU Busy %

The average percentage CPU time all database engines spent not idle.

Cont. Switches %

The percentage of the total number of context switches for one engine divided by those completed for all engines.

Engine Summary Charts

Name

Description

Engine Summary

The following three values, plotted over time:

Engines Busy

Plots how busy an engine was over time. Select from the list of available engines.

Engine Groups / Thread Pools Busy 1

Plots an average of how busy an engine group or thread pool was over time. Select from the list of available engine groups or thread pools.


1

For thread pools, this information is only available from Sybase ASE 15.7 ESD2 and later.


To view a plot of the maximum value over the course of the time period, select Show Maximum.

Engines Processes Tab

Previous Next


Engines Processes Tab

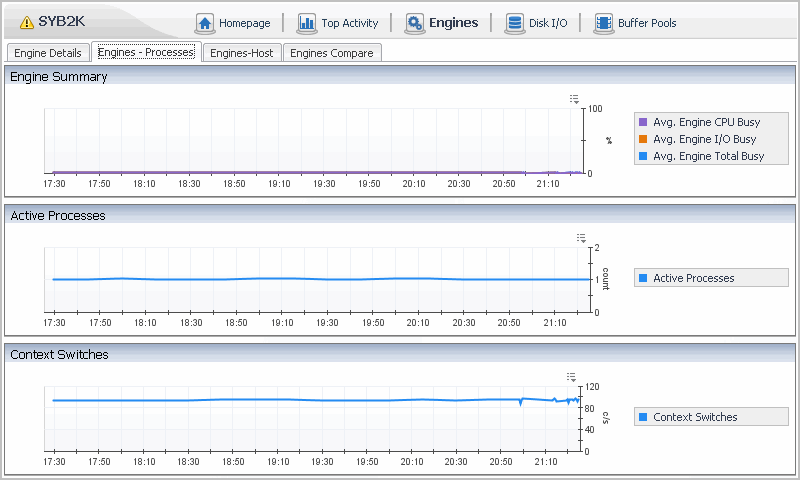
The engine processes information is provided in three charts.

Figure 23. Engines Processes Tab

Engine Processes Charts

Table 32. Engine Processes Chart Description

Name

Description

Engine Summary

The following values, plotted over time:

Active Processes

The number of engine processes running, plotted over time.

Context Switches

The number of engine context switches, plotted over time.

Engines Host Tab

Previous Next


Engines Host Tab

The engines host information is provided in two charts.

Engines Host Charts

Table 33. Engine Host Charts Descriptions

Name

Description

Engines Host

The following values, plotted over time, for each engine:

All Engines Activity

The percentage of activity for each engine.

Engines Compare Tab

Previous Next


Engines Compare Tab

The engines compare information is provided in three charts.

Engines Compare Charts

Table 34. Engines Compare Charts Description

Name

Description

Engines - time range

The following values, plotted over time:

Engines - month, day, year

This displays the plotted values for the previous day (that is, yesterday).

The following values, plotted over time:

Engines - month, day, year

This displays the plotted values from today minus seven days (that is, a week ago) for a 24 hour period.

The following values, plotted over time:

関連ドキュメント

The document was helpful.

評価を選択

I easily found the information I needed.

評価を選択