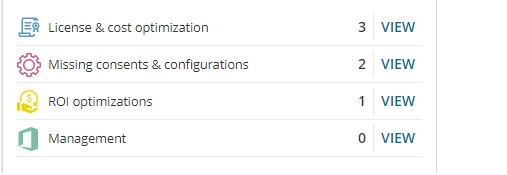
Needs your attention
|
• |
Inactive licenses show users that have not used any of the licensed services within the past 30 or 90 days. You can click VIEW to see which users have inactive licenses within these time periods. |
Paid license distribution
|
• |
The Licenses by Type shows the distribution of the license types listed. |
|
• |
The Licenses by Cost is an estimate of the total cost for licenses purchased per month. The data is based on Microsoft default rates or customized rates if specified. |
For more information on the data included, see Viewing the summary dashboard.
Product Usage
The Product Usage tile shows the usage of the selected products for the last 30 days, showing active products, inactive products, and disabled licenses. Use the Selected Products filter to limit the bar chart to show only the products you want.
You can drill down to see product usage for the products that you have selected by clicking View Usage. To see licenses that are not being used, click View Inactive Licenses.
License availability
For more information on the data included, see Viewing the summary dashboard.


