Transactions view
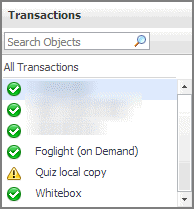
The Transactions view lists the names of transactions that are currently monitored, and shows their states.

Selecting All Transactions shows the overall response and availability information for the monitored transactions in the Summary - All Transactions view on the right. Similarly, selecting a transaction in the list shows transaction-specific metrics in the Transaction view on the right.
|
|
|
• |
Alarm severity. The state of the most recent alarm raised against the associated transaction: Warning  , Critical  , or Fatal  . |
|
• |
All Transactions. A parent node for the transaction object instances that appear in this view. |
|
• |
Transaction. The name of the transaction associated with this Web site. | |
|
|
Drill down on:
|
Table 28. Transactions view
The Transactions view lists the names of transactions that are currently monitored, and shows their states.

Selecting All Transactions shows the overall response and availability information for the monitored transactions in the Summary - All Transactions view on the right. Similarly, selecting a transaction in the list shows transaction-specific metrics in the Transaction view on the right.
|
|
|
• |
Alarm severity. The state of the most recent alarm raised against the associated transaction: Warning  , Critical  , or Fatal  . |
|
• |
All Transactions. A parent node for the transaction object instances that appear in this view. |
|
• |
Transaction. The name of the transaction associated with this Web site. | |
|
|
Drill down on:
|
Web Monitor Environment view
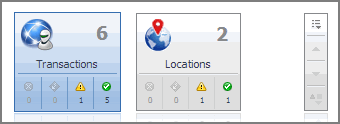
The Web Monitor Environment view displays a high-level overview of your monitored environment. The view has two tiles, each representing the monitored objects of interest Transactions and Locations.

Each tile shows how many of the corresponding object instances there are in your monitored infrastructure, as well as the count of objects of that type in each of the alarm states Normal  , Warning
  , Critical
  , or Fatal
  ). For example, the following image shows six transactions: none in the Fatal or Critical states, one in Warning, and one the Normal state.
You can move the tiles by dragging and dropping until you achieve the desired layout. To hide one or more tiles, on the tool bar on the right, click  , and in the popup that appears, click a tile that you want to hide.

Clicking the object type icon, the object type name, or the object count, shows summary information for that object type in the Quick View. Clicking an alarm state (for example, Warning) on a tile displays summary information in the Quick View for the objects of that type that are in the selected alarm state. If an alarm state has a count of zero, then you can not drill down on the alarm state.
This view appears in the upper part of the Performance Browser, just above the Quick View.
This view is made up of the following embedded views:
Table 29. Locations view
The Web Monitor Environment view displays a high-level overview of your monitored environment. The view has two tiles, each representing the monitored objects of interest Transactions and Locations.

Each tile shows how many of the corresponding object instances there are in your monitored infrastructure, as well as the count of objects of that type in each of the alarm states Normal  , Warning
  , Critical
  , or Fatal
  ). For example, the following image shows six transactions: none in the Fatal or Critical states, one in Warning, and one the Normal state.
You can move the tiles by dragging and dropping until you achieve the desired layout. To hide one or more tiles, on the tool bar on the right, click  , and in the popup that appears, click a tile that you want to hide.

Clicking the object type icon, the object type name, or the object count, shows summary information for that object type in the Quick View. Clicking an alarm state (for example, Warning) on a tile displays summary information in the Quick View for the objects of that type that are in the selected alarm state. If an alarm state has a count of zero, then you can not drill down on the alarm state.
This view appears in the upper part of the Performance Browser, just above the Quick View.
This view is made up of the following embedded views: