The main content window is where you will do most of your interaction with the host machine via the ExpertAssist. For the most part this should be self explanatory.
On most pages you will see a tool bar at the top. Below is a quick key to the buttons you’ll encounter on these toolbars.
Table 1: Main content toolbar buttons.
|
|
|
| |
|
|
|
|
|
|
|
|
|
|
|
|
|
|
|
|
|
|
|
|
The ExpertAssist deploys a system tray (notification area) icon on each client that the ExpertAssist service is deployed on. The icon serves many purposes.
The icon will change on the remote computer when the computer is remotely controlled via the Remote Control applet.
To enable/disable the system tray icon on the host computer:
Use the Appearance section of the Preferences node to modify the Systray Settings.
To open a dialog with the ExpertAssist status and configuration settings, as well as access support information:
Double-click the notification area icon and make the necessary changes or view the information.
To open the ExpertAssist system tray context menu:
Right-click the ExpertAssist system tray. Use the menu options described below:
Open ExpertAssist
This is the default action. Choosing this is equivalent to double-clicking the icon. Select this menu item to load the ExpertAssist management dialog. From this dialog you can open the ExpertAssist using the default web browser, see the ExpertAssist status (enabled or disabled), if the ExpertAssist is currently being accessed or not, and a link to download the documentation.
Open ExpertAssist Web Interface
Select this menu item to load the ExpertAssist on the local machine using the default web browser. NTLM Login will be used.
Open Status Window
Selecting this item displays the ExpertAssist status window. The status window will display a log of all events that have occurred during the past remote management sessions.
Enable/Disable ExpertAssist
Here you can turn the ExpertAssist services on and off at will.
Enable/Disable Status Indicators
Here you can enable or disable the memory and CPU usage indicators.
Show Performance Windows
This menu provides a selection of performance indicators to display on your desktop.
The menu selections displayed are based on the performance data ExpertAssist is able to collect from the client. The software automatically collects performance data on CPU usage (total and broken down by individual CPU on SMP systems), and various memory counters. You also can monitor network performance and drive usage in the real time.
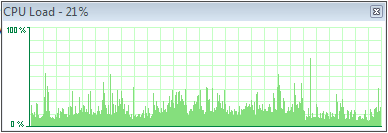
When you select an item from this menu, a window will pop up, similar to this:
The performance window.

Double-clicking the performance window will shrink it to a smaller format.
You can have as many of these windows up on your screen as you want. They are persistent – that is, they will automatically appear in their previous position following a reboot.
About
Opens the ExpertAssist About window, providing the software manufacturer and license information.
Home is the page that you will see when you start up the ExpertAssist. Here you will find a useful at-a-glance System Overview information. Your current ExpertAssist licensing status, legal notices, and technical support contacts are available on the separate tabs.
Each tab is described below.
The About tab provides info on the version of ExpertAssist you are currently using.
This tab contains a link to the page with legal terms and conditions of your license for your reference.
This tab provides info on general copyright data.
Contacts is a link to the product owner site to find out more about this and other products.
Here you'll also find the support pages, along with the popular forums and Knowledgebase articles. If the answer isn't in the manual you may well find it there.
When you start up ExpertAssist, you will see the System Overview tab. It contains a multitude of useful information about the host computer.
At the top of the page you'll see the following info:
The date and time of the host machine.
Click on the date and time (highlighted in blue) to open a page where you can set the time on that machine.
The date and time of the host machine page is also accessible on the Time page of the Computer Settings.
In the top right corner of the System Overview section of the ExpertAssist Home page, you can see a summary of your security data. This includes the following:
QuickLinks are designed to make access to frequently used features quick and easy.
To view the pages added to ExpertAssist's QuickLinks:
Click the icon in the box on the right hand side of the home page.
Or,
Use the dropdown in the upper frame of every page.
To add a QuickLink:
Click on the QuickLinks icon, which appears on every page.
To remove a QuickLink:
Select Edit your QuickLinks command from the drop down menu.
The performance graph details CPU and memory usage. Data about the physical and committed memory are displayed in an easy to read green and red graph.
Here you can see information about the users who have most recently accessed the ExpertAssist on this computer.
Here you can see data on any current connections on the host machine.
Here you can see information on the computer itself, including the current CPU utilization.
An overview of the operating system of the accessed machine is displayed here, including when it was installed.
Here you can see a list of the Hotfixes that have been installed on the machine.
For more information about a particular Hotfix:
Click on the Hotfix name .
Alternatively, you can view the list of installed hotfixes listed with other updates and applications installed on the remote computer on the Installed Applications page available under Performance Monitoring object.