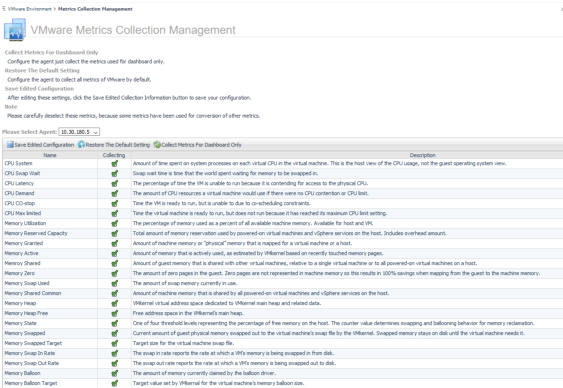
Metrics Collection Management View
The Metrics Collection Management view is used to configure the metrics collect by agent. VMware agent has collect total 99 metrics from vCenter, but some metrics are not used to VMware dashboard and relate products (Capacity Director, Optimizer and so on), less metrics collection can reduce the pressure of collection from vCenter and improve performance for agent on large environment. This view is for this purpose and user can disable the collection of these metrics at this view.
|
• |
Save Edited Configuration: After editing these settings, click the Save Edited Collection Information button to save your configuration. |
Data displayed
|
• |
Collecting: Agent collect this metric or not, agent collect it when it selected. |
Quick-View
The Quick-View displays summary information about the objects you select from the Virtual Environment Overview, which is also available on the Virtual Environment Summary dashboard.

The Quick-View is made up of two embedded views—the Object Tree view and the Object Summary view. Depending on what is selected in the Object Tree view, the Object Summary view, located at the right of the Quick-View, displays summary information for either a single object or for a group of objects of a particular type.
The Quick-View appears in the middle of the display area.
Resource Pool Summary view
The Resource Pool Summary view shows the overall resource utilization and the amounts of system resource consumption for a physical resource pool.
The Resource Pool Summary view appears on the right.
This view is made up of the following embedded views:
|
|
Shows the numbers and states of the selected resource pool and other components associated with the resource pool. |
|
|
|
• |
Cluster. The name of the cluster associated with the selected resource pool, followed by the related alarm counts. | |
|
|
|
• |
Datacenter. The name of the datacenter associated with the selected resource pool, followed by the related alarm counts. | |
|
|
|
• |
Resource Pools. The name of the selected resource pool, followed by the related alarm counts. | |
|
|
|
• |
Virtual Center. The name of the virtual center associated with the selected resource pool, followed by the related alarm counts. | |
|
|
|
• |
Virtual Machines. The number of virtual machines that are associated with the selected resource pool, followed by the related alarm counts. | |
|
|
Drill down on: |
|
|
|
• |
Alarm count. Displays the Alarms dialog box that shows a list of all related alarms. For each alarm entry, it shows its severity, the time at which it was triggered, the rule name that triggered the alarm, and the alarm message. |
|
|
|
|
• |
Cluster. Displays the Clusters Inventory dwell, showing the name and state of the cluster associated with the selected resource pool. |
|
|
|
|
• |
Datacenter. Displays the Datacenters Inventory dwell, showing the name and state of the datacenter associated with the selected resource pool. |
|
|
|
|
• |
Resource Pool. Displays the Resource Pools Inventory dwell, showing the name and state of the selected resource pool. |
|
|
|
|
• |
Virtual Center. Displays the Virtual Centers Inventory dwell, showing the name and state of the virtual center associated with the selected resource pool. |
|
|
|
|
• |
Virtual Machines. Displays the Virtual Machines Inventory dwell, showing the names and states of all virtual machines that are associated with the selected resource pool. |
|
|
|
Shows the resource consumption for the selected resource pool broken down into four simple views. |
|
|
|
• |
CPU Load. The current percentage of the selected resource pool’s CPU load, used to execute system code and user programs, based on the total CPU capacity. | |
|
|
|
• |
CPU Utilization, % Ready. The percentage of the resource pool’s CPU resources that is ready to execute system code and user programs during the selected time period. | |
|
|
|
• |
CPU Utilization, % Used. The percentage of the CPU utilization used by the resource pool to execute system code and user programs, during the selected time period. | |
|
|
|
• |
Disk I/O. The current disk I/O rate for the selected resource pool. | |
|
|
|
|
|
|
|
|
|
• |
Memory Usage. The current percentage of the average memory usage by the selected resource pool, based on the total memory capacity. | |
|
|
|
• |
Memory Utilization, Active. The amount of the available memory used by the selected resource pool during the selected time period. | |
|
|
|
• |
Memory Utilization, Ballooned. The amount of physical memory that is actively being used by the VMware Memory Control Driver to allow the guest OS to selectively swap memory. | |
|
|
|
|
|
|
|
|
|
• |
Network I/O. The current rate at which the selected resource pool transfers data from and to the network. | |
|
|
|
|
|
|
• |
Network Utilization, Send Rate. The rate at which the selected resource pool sends data to the network during the selected time period. | |
|
|
Drill down on: |
|
|
|
• |
CPU Load spinner. Displays the CPU Load dialog box. |
|
|
|
|
|
|
|
• |
Disk I/O spinner. Displays the Disk I/O dialog box. |
|
|
|
|
|
|
|
|
|
|
• |
Network I/O spinner. Displays the Network I/O dialog box. |
|
|
|
|
Summary - All Resource Pools view
The Summary - All Resource Pools view displays overall resource utilization information for a group of physical resource pools and shows the elements that consume the highest amount of system resources.

The Summary - All Resource Pools view appears on the right.
This view is made up of the following embedded views: