Regions view
The Regions tree view lists the regions existing in your Azure environment and shows their state. This view appears on the left when you select the Regions tile in the Actions bar.
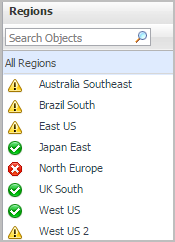
Selecting the All Regions node displays the Summary - All Regions view on the right. Similarly, selecting a region node shows region-specific metrics in the Region Summary view on the right.
Summary - All Regions view
The Summary - All Regions view appears on the right when you select All Regions in the Regions view.
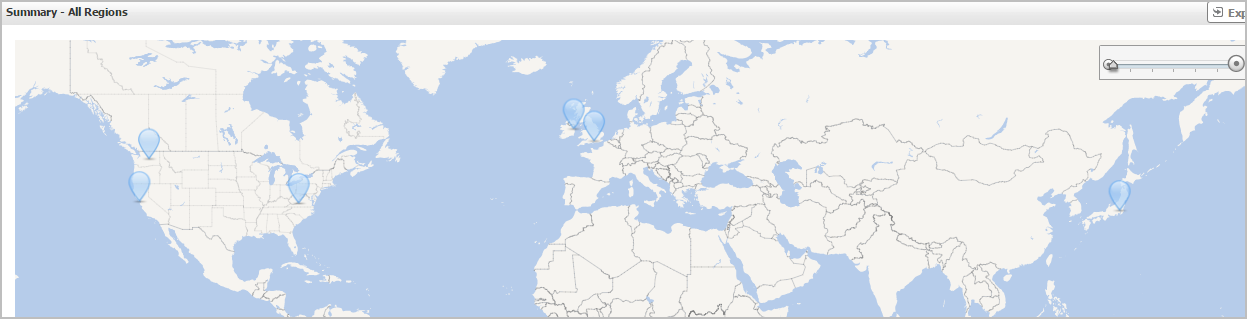
Hover over any bubble in this graph to display a dwell, showing Resource Groups, Virtual Machines, Storage Accounts, and Virtual Networks.
Click any bubble in this graph to open the Region Explorer dialog box, showing Virtual Machines, Storage Accounts, Resource Groups, and Virtual Networks.
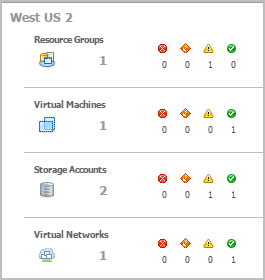
Region Summary view
The Region Summary view appears on the right when you select a region in the Regions view.
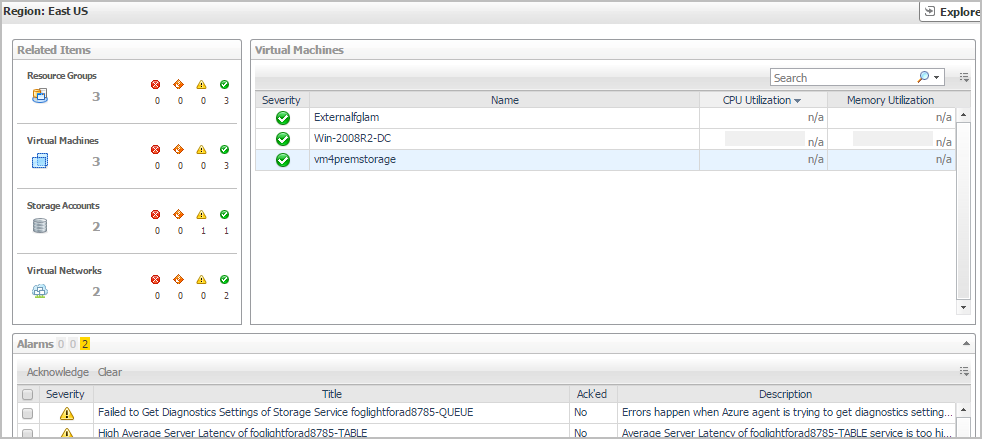
This view consists of the following embedded views:
|
|
Shows the numbers and states of the selected regions. |
|
|
|
• |
Resource Groups. The number of the resource groups that are associated with the selected region, followed by related alarm counts, broken down by the alarm state (Normal, Warning, Critical, Fatal). | |
|
|
|
• |
Virtual Machines. The number of the virtual machines that are associated with the selected region, followed by related alarm counts, broken down by the alarm state (Normal, Warning, Critical, Fatal). | |
|
|
|
• |
Storage Accounts. The number of the storage accounts that are that are associated with the selected region, followed by related alarm counts, broken down by the alarm state (Normal, Warning, Critical, Fatal). | |
|
|
|
• |
Virtual Networks. The number of the virtual networks that are that are associated with the selected region, followed by related alarm counts, broken down by the alarm state (Normal, Warning, Critical, Fatal). | |
|
|
Drill down on: |
|
|
|
• |
Resource Groups. Displays the Resource Groups dwell, showing the name and state of the associated Resource Groups. |
|
|
|
|
• |
Virtual Machines. Displays the Virtual Machines dwell, showing the name and state of the associated virtual machine. |
|
|
|
|
• |
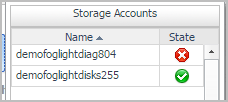
Storage Accounts. Displays the Servers dwell, showing the name and state of the associated storage accounts. |
|
|
|
|
• |
Virtual Networks. Displays the Virtual Networks dwell, showing the name and state of the associated virtual networks. |
|
|
|
Shows a table, showing the information about the virtual machines associated with the selected region. |
|
|
|
• |
Severity. Indicates the alarm severity: Warning, Critical, or Fatal. | |
|
|
|
• |
Name. The name of the virtual machine. | |
|
|
|
|
|
|
|
|
Drill down on: |
|
|
|
• |
CPU Utilization. Displays the CPU Utilization dialog box, including CPU Utilization, % Privileged Time, and % User Time. | |
|
|
|
• |
Memory Utilization. Displays the Memory Usage dialog box, including Memory Utilization and % Available Paging Space. | |
|
|
|
• |
Name. Displays the Virtual Machine view, showing the metrics of Resource Information, CPU, Memory, Network, and Storage. | |
Virtual Machines monitoring
The Virtual Machines (VM) view shows the data collected about a specific Azure virtual machine or all Azure virtual machines. For more information, see the following topics: