A component dashboard is a drill-down view that displays physical details about a selected component, performance and capacity metrics, and alarms. Some also include a topology diagram that shows how the component fits into the monitored environment; for more information, see Exploring Connectivity with SAN Topology Diagrams.
For information about each type of component dashboard, see the following topics:
|
2 |
Review overall performance in the Summary tab. |
|
• |
Aggregate Details. Displays the aggregate’s status, parent filer, health score, and current values for Advertised NASVolumes Size, Total Usable Capacity, Available Usable Capacity, Overcommitment, Data Rate, and Ops Rate. Click a |
|
• |
Pool Performance. Displays the same performance metrics found in the Aggregate Details view, but in chart format. |
|
• |
Perform Pool Change Analysis. Click to identify the NASVolumes and LUNs primarily responsible for increased I/O. For more information, see Analyzing the Pool. |
|
• |
Perform Pool Load Analysis. Click to identify the busiest NASVolumes and LUNs, and rank them based on their activity during the same time range over the last 30 days. For more information, see Analyzing the Pool. |
|
3 |
Click the Capacity tab. |
|
• |
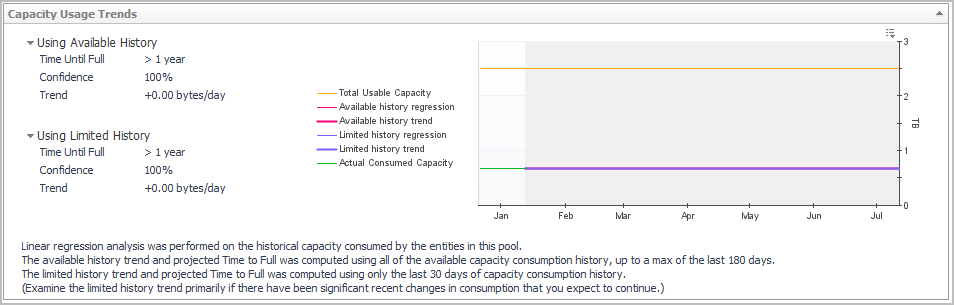
Capacity Usage Trends: Chart provides a visual display of the estimated capacity consumption in the future, based on a regression analysis of the historical capacity consumption. |
|
4 |
Click the Consumers tab. |
|
• |
Aggregate Details. Displays the aggregate’s status, parent filer, and current values for Advertised LUNs Size, Advertised NASVolumes Size, Total Usable Capacity, Available Usable Capacity, and Overcommitment. |
|
• |
NASVolumes Using This Aggregate. For each volume, displays its name, status, physical state, and whether the NASVolume is used by an entity in the monitored environment. The metric columns display current values for Data Rate, Latency, Advertised NASVolumes Size, Used Capacity, and % Used. Click a |
|
• |
LUNs Using This Aggregate. For each LUN, displays its name, status, physical state, and whether the LUN is used by an entity in the monitored environment. The metric columns display current values for Data Rate, Ops Rate, Latency, % Busy, and Advertised LUNs Size. Click a |
|
5 |
Click the Disks tab. |
|
• |
Click a NASVolume name. See Investigating a NASVolume (includes a topology diagram). |
|
• |
Click a LUN name. See Investigating a LUN (includes a topology diagram). |
|
2 |
Review overall performance in the Summary tab. |
|
• |
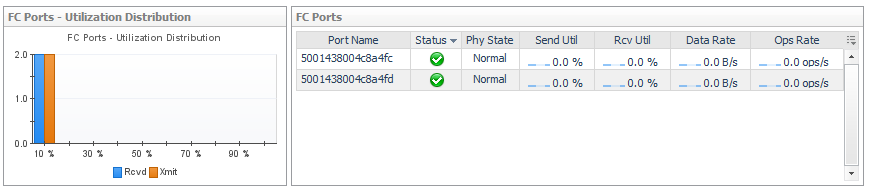
Details. Displays the port’s status, physical details, parent storage array or filer, port controller (for filers and non-cluster arrays) or member node (for cluster arrays), and current values for Data Rate, Ops Rate, Xmit Utilization, and Rcvd Utilization. |
|
• |
Charts. Displays the following metrics over the time period, if available: |
|
• |
Alarm Summary. Displays alarms on the port. |
|
3 |
If available, click the Topology tab. This tab is displayed for Fibre Channel (FC) ports only. |
|
• |
Basic Connectivity (diagram). Displays the selected port (left box) and its connection to its controller. If the port is an FC port, the N port on the fibre switch it connects to is also displayed. |
|
• |
Port Dependencies. On separate tabs, displays connections to LUNs (through the selected port) from virtual machines, ESX or Hyper-V servers, and physical hosts. If the selected port has problems or failures, the connected VMs or hosts may exhibit performance problems. |
|
2 |
Review overall performance in the Summary tab. |
|
• |
Controller Details. Displays the controller’s status, physical details, and parent device. |
|
• |
Charts. Displays the following metrics over the time period, if available: |
|
• |
Alarm Summary. Displays alarms on the controller. |
|
3 |
Review Port performance in the Port tab. |
|
• |
Port Details. List the ports, their status and physical state, and current values for Data Rate and Ops Rate. Click a |