Using the Web Component Tutorial
Browser Interface Views
How to Use this Tutorial
Tutorial 1: Drag and Drop
Tutorial 2: Creating a Dashboard
Constructing the Tutorial Module
Configuring a Query
Configuring a Row-Oriented Table
Building the Dashboard
Summary
Tutorial 3: Adding a Drilldown Page
Preliminary Setup
Adding a Column of Aggregate Alarms to the Table
Adding a Dependent Page
Summary
Tutorial 4: Adding Views
Designing the Page
Preliminary Setup
Defining the Alarms Query
Configuring a Table of Alarms
Configuring a Chart Component
Configuring a Label with an Action
Configuring the Drilldown Page
Configuring a Drop-Down List
Flowing Monitored Hosts to Host Details T3
Adding a Customizer
Adding Nested Views
Summary
Tutorial 5: Using a Grid
Tutorial 6: Reports
Configuring a Query
Creating a Basic Report Page
Creating a More Elaborate Hosts Table
Adding a Header
Adding a Footer
Adding an Iterator for a Multi-Page Report
Summary
Tutorial 7: Creating a Form
About this Tutorial
Defining the Enumerated Types for Manager and Staff
Defining the Manager and Staff Types
Defining the Company Type
Defining the Functions for Adding and Removing a Manager
Defining the Labels
Defining the Bean Input Components
Defining the Grid Layout
Defining the Dialog
Defining the Table of Managers
Summary
Tutorial 8: Renderers
Tutorial 9: Adding Questions and Answers
Working with Associations and Question Viewers
Tutorial 10: Sending Messages to Other Users
About Domain Associations
About Question Associations
About Category Associations
About Question Viewers
Building Associations for Your Question Viewer
Populating the Question Viewer with Questions and Answers
Building a Mini-Viewer
Summary
Define a context input
|
1 |
|
3 |
|
4 |
Leave the Name column unchanged. |
|
5 |
|
6 |
|
7 |
|
8 |
Leave the Name column empty. Ignore the warning when saving the component. |
Figure 5. Context Inputs
|
9 |
Click Save in the top-left corner to save your work so far. |
Define a flow
|
1 |
Open the Monitored Hosts view for editing. |
|
2 |
Open the Flow tab. |
|
3 |
In the table left-most column, click Single-row Selection. |
The Edit - Row Selection dialog box opens.
|
4 |
|
5 |
|
6 |
|
7 |
|
8 |
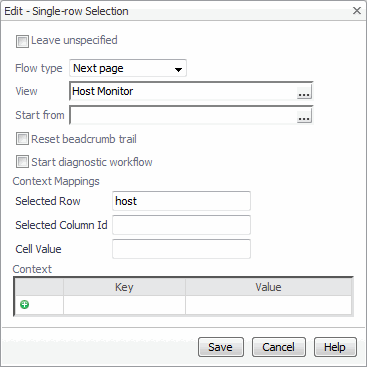
The target page has a required input of host. Here, you are specifying that the selected row pass this key. The Host Monitor view does not show up in the list of available choices unless its required input is satisfied.
|
9 |
The Edit - Single-row Selection dialog box closes and the Single-row Selection entry appears as a node, containing two sub-nodes: On Missing Inputs and On View Not Found. You can set a fallback view to provide an alternate if the drilldown page is not available.
|
10 |
|
11 |
|
12 |
|
13 |
Click Save in the top-left corner to save the changes made to Monitored Hosts. |
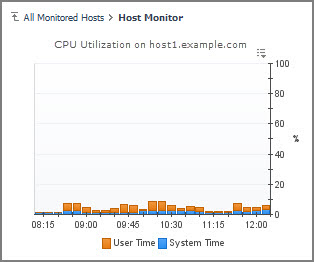
If you test the page at this point after choosing values for the bindings, you see that by clicking on a row of Monitored Hosts, you drill down to the Host Monitor view. The breadcrumb history trail at the top right side of the page refreshes accordingly, showing All Monitored Hosts > Host Monitor.
Populate the dependent page
|
1 |
|
2 |
Click Add. |
|
3 |
|
4 |
|
5 |
Choose Hosts > Host > [chart] CPU Utilization |
|
6 |
We chose an existing page that displays useful data about a host rather than attempting to build such a complex page from scratch. Any page whose purpose is Page and accepts context inputs of timeRange and host can be used. A later tutorial demonstrates how such a page can be constructed.
|
7 |
The next page of the Add View dialog box appears. It allows you to set properties for the view. |
|
8 |
Accept the default setting for the Width and Height properties by selecting these check boxes, along with Show Title and Show Border. |
|
9 |
|
10 |
Click Save in the top-left corner to save the changes made to the Host Monitor view. |
|
11 |
|
12 |
Click a row of the table to drill down to the Host Monitor view. |
Figure 6. Newly created page


