Using a single pane of glass for your administration needs
The Administration dashboard can be used as a front-end for most Foglight® administration tasks. This dashboard contains links to most of the administration dashboards and shows configuration specifics that may be critical to your day-to-day operation. If your Foglight role involves daily administration, this is probably the best place to start as it gives you a quick insight into the system complexity and its health, along with close-at-hand links to most administration dashboards.
You can access this dashboard from the navigation panel, by clicking Homes > Administration.
For more information, see the following topics:
Manage Foglight Database Performance
To access this dashboard, from the navigation panel, click Dashboards > Management Server > Servers. Then select either Object Cleanup or Retention Policies.
Another way to control the retention policies on a per-object basis is using the Manage Retention Policies dashboard. For more information, see Manage Data Retention.
In addition to the Object Cleanup and Retention Policies dashboards that allow you to inspect and tune the overall performance, the Database Overview dashboard summarizes the database activities such as data row operations, database buffer pool, and any inserts, deletes, and updates. To access this dashboard, from the navigation panel, click Dashboards > Management Server > Servers > Database Overview.
For more information, see the following topics:
Monitor Server Performance
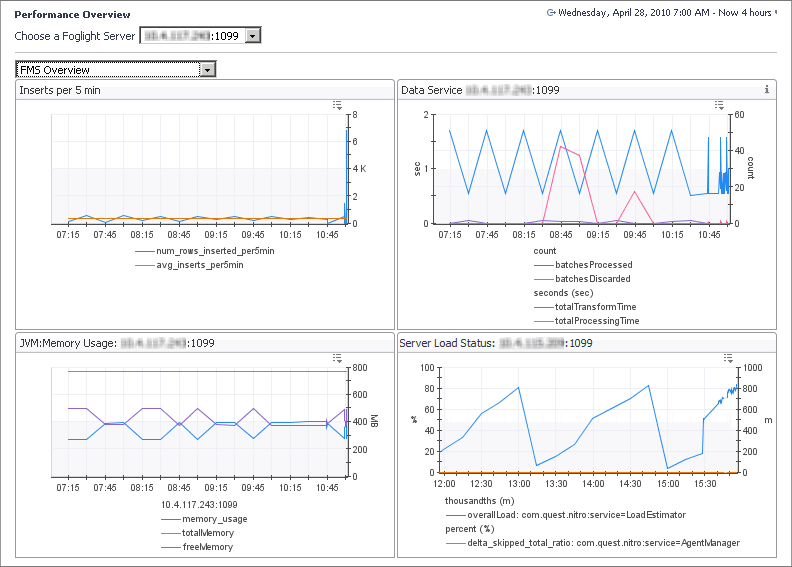
The Performance dashboard contains at-a-glance view of Foglight diagnostics. It shows the rate of database inserts, data processing activity, JVM memory usage, server load, and other combinations of views. Certain types of metric patterns displayed on this dashboard can be useful in troubleshooting specific performance problems. For example, a sudden increase in free memory utilization is a good indicator that the amount of incoming data exceeds typical thresholds. To access this dashboard, from the navigation panel, click Dashboards > Management Server > Diagnostic > Performance.
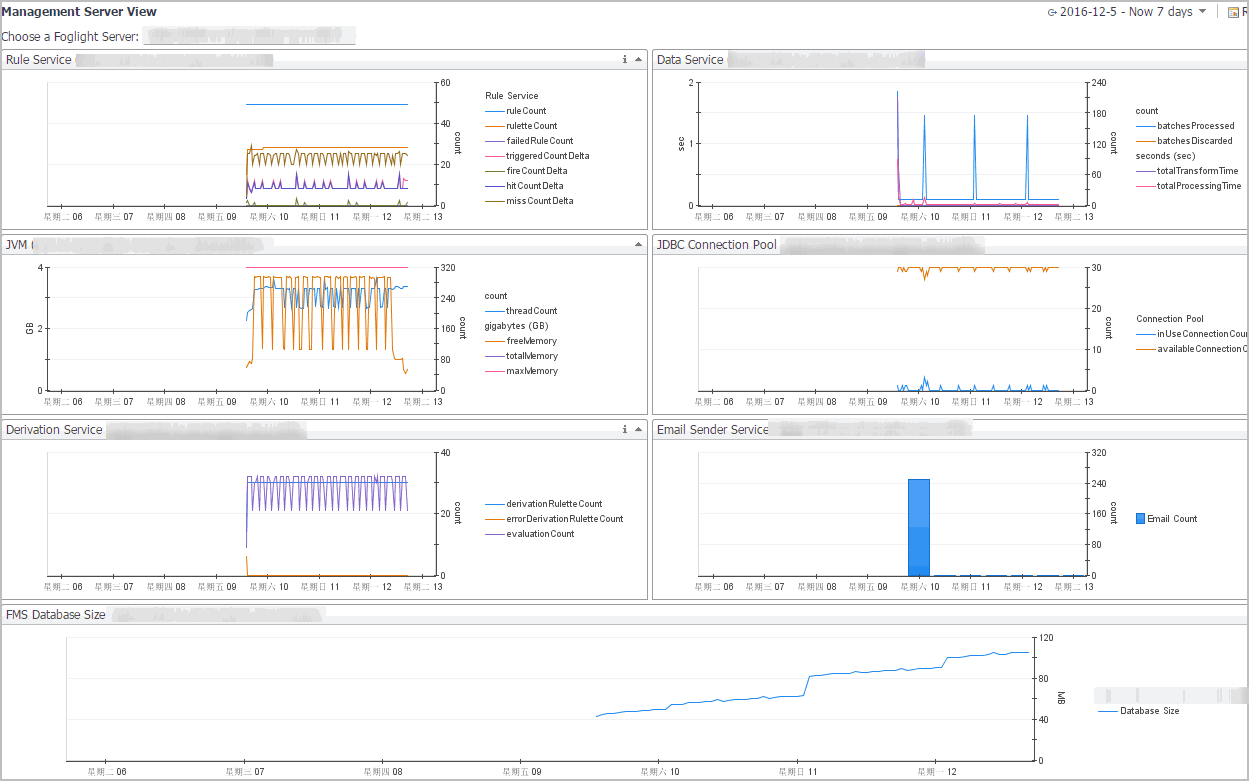
The Management Server View dashboard is useful for examining server performance. Use it to look for root causes of server-related performance problems. To access this dashboard, from the navigation panel, click Dashboards > Management Server > Servers > Management Server View.
Server log files are another source of information that can help you diagnose the root cause of performance-related bottlenecks. They contain information about known events and error conditions as well as verbose or informational messages. The Log Analyzer dashboard allows you to analyze generated log files or download a selected log file to a desired location. To access this dashboard, from the navigation panel, click Dashboards > Management Server > Diagnostic > Log Analyzer.
For more information, see the following topics:
Monitor Agent Manager Performance
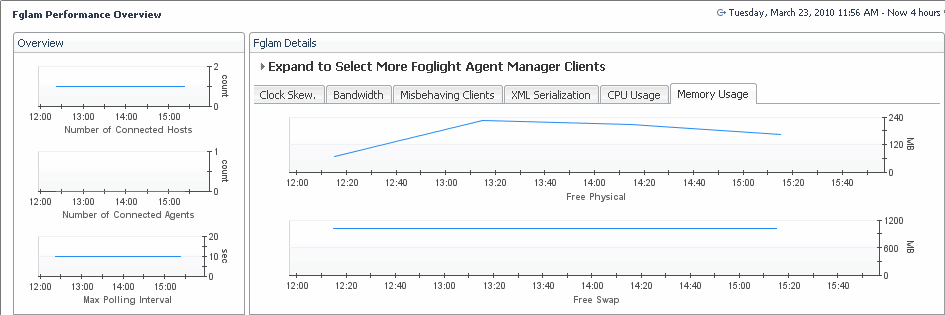
Foglight uses the Agent Manager to communicate with monitored hosts. The embedded Agent Manager can be used to monitor the host on which the Management Server is installed. Your monitoring environment typically includes a number of Agent Manager instances that are installed on different hosts. You can monitor their state using the Performance Overview dashboard. For example, an unusually high number of pending messages in the queue indicates a potential performance bottleneck. To access this dashboard, from the navigation panel, click Dashboards > Management Server > Diagnostic > Agent Manager.
For more information, see the following topics:
|
• |
|
• |
Explore the Message Processing tab |
|
• |
Explore the Clock Skew tab |
|
• |
Explore the Bandwidth tab |
|
• |
Explore the Misbehaving Clients tab |
|
• |
Explore the XML Serialization tab |


