サポートと今すぐチャット
サポートとのチャット

Foglight for Hyper-V 5.8.3 - User Guide

About Foglight for Hyper-V Agent administration Performance monitoring with the Hyper-V Environment dashboard Performance investigation with the Hyper-V Explorer Foglight for Hyper-V alarms Appendix: Hyper-V Agent error codes

Storage monitoring

A Microsoft Windows Cluster Shared Volume (CSV) is a shared disk available for read and write operations by all nodes within a Windows Server Failover Cluster. A Windows Server Failover Cluster is a group of computers that provides continued service when system components fail.

To review data collected about a specific volume or all volumes, make your selection in the Quick-View.

Storage view

The Storage view is a tree view. It lists the server volumes and cluster volumes existing in your environment, and shows their severity state.

This view appears in the Quick-View on the left when you select the Storage tile in the Virtual Environment view.
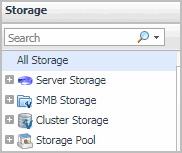
Figure 118. Storage view

Selecting the All Storage node displays the overall resource utilization for all volumes in your integrated system and identifies the ones that consume the highest amount of system resources in the Summary - All Storage view on the right. Similarly, selecting a storage node shows storage-specific metrics in the Volume Summary view.

Alarm severity. The state of the most recent alarm raised against the volume.
All Storage. A parent node for the instances of all volumes that appear in this view.
Server Storage. The parent node for the instances of all server storage.
SMB Storage. The parent node for the instances of all SMB storage.
Cluster Storage. The parent node for the instances of all cluster storage.
Storage Pool. The parent node for the instances of all storage pools.

Drill down on:

Summary - All Storage view

The Summary - All Storage view displays overall resource utilization information for all volumes in the selected service and identifies the elements that consume the highest amount of resources.

This view appears in the Quick-View on the left when you select All Storage in the Storage view.
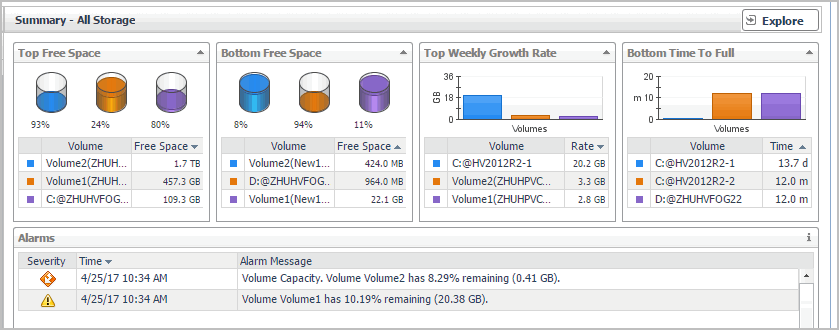
Figure 119. Summary - All Storage view

This view is made up of the following embedded views:

Table 68. Alarms

Lists the alarms generated against the monitored volumes.

Alarm Message. An explanation about why the alarm occurred.
Severity. Indicates the alarm severity: Warning, Critical, or Fatal.
Time. The time at which the alarm was generated.

Drill down on:

Alarm Message, Severity, or Time. Displays the Alarm dialog box, showing additional information about the alarm. For more information about alarms in Foglight, see the Foglight User Help.

Identifies the volumes with the smallest amounts of free space during the selected time range.

Volume. The name of the volume identified amongst those with the lowest amount of free space.
Free space. The amount of available space on the volume.

Drill down on:

Volume. Shows the Volume view.

Identifies the volumes that are most likely to become full during the selected time range.

Volume. The name of the volume identified as being likely to become full.
Rate. The projected amount of time after which the volume becomes full.

Drill down on:

Volume. Shows the Volume view.
Table 71. Top Free Space

Identifies the volumes with the highest amounts of free space during the selected time range.

Volume. The name of the volume identified as having a high amount of free space.
Free space. The amount of space available on the volume.

Drill down on:

Volume. Shows the Volume view.


Identifies the volumes with the highest growth rate of used disk space on a weekly basis.

Volume. The name of the volume identified as having high weekly growth rate.
Rate. The rate at which the associated virtual machines use the disk space.

Drill down on:

Volume. Shows the Volume view.

Volumes Summary view

The Volumes Summary view displays complete details for all volumes in the selected service and identifies the ones that consume the lowest amounts of disk resources.

This view appears in the display area when you click Explore in the Summary - All Storage view.
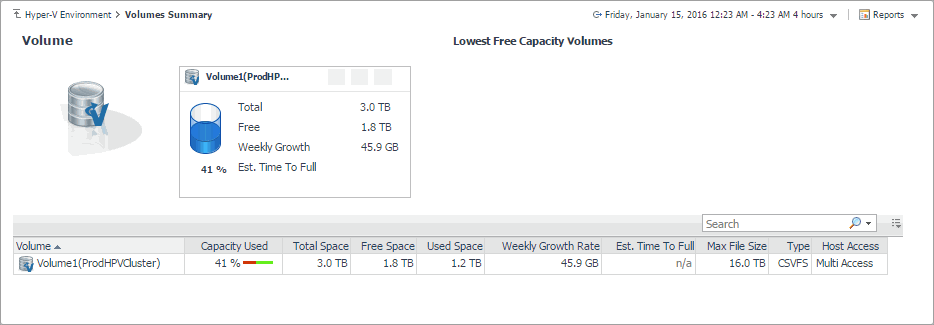
Figure 120. Volumes Summary view

This view is made up of the following embedded views:

Table 73. Volume table

Lists all volumes that are available in the selected service.

Capacity Used. The percentage of the volume space that is currently in use.
Est. Time Until Full. The estimated amount of time after which the selected volume becomes full.
Free Space. The amount of volume space that is available for use.
Host Access. Indicates if multiple servers can access to this host.
Max File Size. The maximum file size on the selected volume.
Total Space. The total amount of volume space, including free and used space.
Type. The file system on the selected volume.
URL. The URL to the selected volume.
Used Space. The amount of volume space that is currently in use.
Volume. The name of the volume identified amongst those with the lowest amount of free space.
Weekly Growth Rate. The projected amount of the volume space that becomes in use on a weekly basis.

Drill down on:

Any column. Shows the volume details in the Volume view.
Table 74. Volume tile

For each volume identified amongst those with lowest capacity, this tile provides some basic resource usage indicators.

Free. The amount of volume space that is available for use.
Percent Free. The percentage of volume space that is available for use.
Total. The total amount of volume space, including free and used space.
Volume. The name of the volume, followed by the related alarm counts.
Weekly Growth Rate. The projected amount of the volume space that becomes in use on a weekly basis.
関連ドキュメント

The document was helpful.

評価を選択

I easily found the information I needed.

評価を選択