サポートと今すぐチャット
サポートとのチャット

Spotlight on DB2 6.10 - User Guide

Spotlight on IBM DB2 LUW (Linux, Unix, and Windows)
New in This Release Getting started with Spotlight on IBM DB2 LUW Desktop features specific to Spotlight on IBM DB2 LUW Spotlight on IBM DB2 LUW drilldowns
About Spotlight on IBM DB2 LUW drilldowns Buffer Pool Analysis drilldown Client Application Analysis drilldown Database Analysis drilldown Database Manager Summary drilldown Diagnostic Log drilldown FCM Analysis drilldown Tablespace Analysis drilldown Top SQL drilldown Operating System drilldown Workload Management Analysis drilldown
Spotlight on IBM DB2 LUW alarms Spotlight on IBM DB2 LUW Options Tuning SQL statements in Spotlight on IBM DB2 LUW
Spotlight Basics
Spotlight Connections Monitor Spotlight Connections Alarms Charts, Grids And Home Page Components View | Options Troubleshooting
Spotlight History Spotlight on Windows
Connect to Windows Systems Background Information Home Page Alarms Drilldowns View | Options Troubleshooting
Spotlight on Unix About us Third-party contributions Copyright

Data Read Rate graph

The Data Read Rate graph depicts rates for retrieving data pages from the selected buffer pool over consecutive monitoring intervals. These rates are based on the number of pages read per second. The graph contains the following series:

  • Logical —Plots the rate of read requests for data pages that are already in the buffer pool.

  • Physical —Plots the rate at which logical read requests required actual database I/O to get the data pages into the buffer pool first. When the physical read rate is consistently higher than the logical read rate, the buffer pool is not being used effectively.
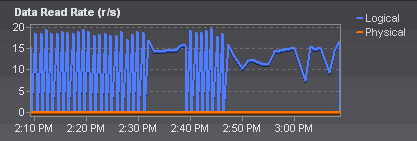
  • Synch —Plots the rate of synchronous data reads. When synchronous reads are used to retrieve data pages from the database to put them into the buffer pool, further execution of the query is blocked until these reads are completed. A high synchronous read rate can degrade performance.

For related statistical information

The Statistics tab shows the buffer pool read counts used to generate this graph. The names for these statistics begin with Buffer Pool. These statistics are derived from the POOL data elements that the DB2 snapshot monitor captures.

関連ドキュメント

The document was helpful.

評価を選択

I easily found the information I needed.

評価を選択