サポートと今すぐチャット
サポートとのチャット

Foglight for DB2 (Cartridge) 5.9.5.10 - User Guide

Introduction to Foglight for DB2 LUW Using Foglight for DB2 LUW Reference
Dashboards and Views Collections and Metrics
CF Locks Collection CF Memory Pools Collection CF Resource Usage Collection Current Agents Details Collection Agents Summary Collection Current Locks Wait Collection Database Bufferpools Summary PS Collection Database Configuration Collection Database Tablespaces Collection Database Tablespaces Summary Collection Database Usability Collection Database Parameters Collection Database Instance Parameters Collection Database Instance Registry Variables Collection Database Tablespaces BP Collection FCM Activity Collection FS DB Storage Collection FS DB Storage Summary Collection FS Instance Storage Collection FS Storage Collection FS Storage Summary Collection General Activity Collection HADR Activity Collection Host Properties Collection OS General Collection Instance Activity Collection Instance General Collection Instance Nodes Collection Instance Usability Collection IO Activity Collection License Details Collection Log Activity Collection Log File Collection Log Message Collection Messages Count Collection Monitor Switches Collection OS DB2 General Process Collection Partition Tablespaces Summary Collection Partition Usability Collection pureScale Alerts Collection Top SQLs Collection Query Agents Details Collection Database Partition Activity Collection DB2 Partition Subcategories Wait Collection History Locks Wait Collection History Locks Summary Collection Instance Memory Collection Instance Memory Pool Collection Instance Memory Summary Collection Instance Memory Total Collection Database Memory Collection Database Memory Pool Collection Database Memory Pool DB Collection Database Memory Summary Collection Database Memory Total Collection Database Buffer Pools Collection Database Tables Collection Database Partition Backup Collection Database Tables Global Collection Database Applications Collection

Summary

This home page contains the following panes:

The Workload pane displays the session activity and CPU usage information for the selected partition. It is at the upper left of the Partition (History) home page.

CPU Wait Time. The average CPU wait time (in milliseconds), plotted over the course of the selected time range.
Average Active Sessions. A comparison of the average number of active sessions over the course of the selected time range with the average number of active sessions expected (according to the baseline).
CPU Usage. The percentage of CPU used by the partition, plotted over the course of the selected time range.

Mousing over a data point on either of the charts displays a pop-up that provides more detailed information about the data point.

Clicking the Investigate using the “Top SQL” drilldown link takes you to the Top SQL pane for additional information.

The Storage pane displays the storage information for the selected partition. It is at the upper right of the Partition (History) home page.

Storage Graph. The storage activity of the partition plotted over the course of the selected time range.

The storage can be plotted as either:

Avg. Consumption (MB/hour). The average storage space consumed (in MB/hour) over the course of the selected time range.
Total Allocated (MB). The total storage space allocated (in MB).

Mousing over a data point on the plot displays a pop-up that provides more detailed information about the data point.

Clicking the Investigate using the “Table Space” drilldown link takes you to the Tablespaces pane for additional information.

The OS Performance pane displays the OS performance information for the selected partition. It is at the bottom left of the Partition (History) home page.

Avg. CPU (%). The average CPU consumed, as a percentage of the total allocated, over the course of the selected time range.
Avg. Memory (%). The average memory consumed, as a percentage of the total allocated, over the course of the selected time range.
Disk Utilization (%). The disk utilization, as a percentage of the total allocated, over the course of the selected time range.

Clicking any of the three charts displays a pop-up that provides additional, related information.

On the pop-up, clicking the Investigate using the “Host Monitor” drilldown link takes you to the Host Monitor dashboard for additional information.

The Availability pane displays the availability information for the selected partition. It is at the lower middle of the Partition (History) home page.

Sessions. The availability of the active and inactive sessions plotted over the course of the selected time range.
Member Availability. The average availability of the partition over the course of the selected time range.
Average Request Time (ms). The average length of time (in ms) it took to process a single request, over the course of the selected time range.
Transaction Rate. The number of transactions being processed per second.

Mousing over a data point on the Sessions chart displays a pop-up that provides more detailed information about the data point.

Clicking anywhere on the Partition Availability chart displays a pop-up that provides additional, related information.

Clicking the icon next to the Avg. Request Time or Transaction Rate metric displays a pop-up that provides additional, related information.

The Cache Hit Ratio pane displays the cache hit ratio information for the selected partition. It is at the right of the Partition (History) home page.

Total BP (%). The percentage of database page I/O requests that were satisfied using the buffer cache (and therefore the database did not have to perform disk reads), over the course of the selected time range.
Package (%). The number of times that a requested section was not available for use and had to be loaded into the package cache, as a percentage of the total number of times that a section was requested, over the course of the selected time range.
Catalog (%). The number of times that a table descriptor or authorization information was not found in the catalog cache and had to be inserted there, as a percentage of the total number of times that a table descriptor or authorization information was requested, over the course of the selected time range.

Clicking the icon next to any of the cache hit ratios displays a pop-up that provides additional, related information.

Clicking the link at the bottom of any of the three pop-ups takes you to the corresponding dashboard for additional information.

If the database is configured for HADR, the HADR pane displays the associated HADR metrics for the partition. It is at the bottom right of the Partition (History) home page. For more information on these parameters, see HADR Activity Collection .

Role. The HADR role of the database.
HADR Remote Host. The name of the HADR remote host.
HADR Remote Instance. The name of the HADR remote instance.
Log Gap. The size (in KB) of the gap between the primary log sequence number and the standby log sequence number.
HADR State. The HADR state of the database:

Clicking the icon next to a metric displays a pop-up with additional, related information.

Member (Real Time) home page

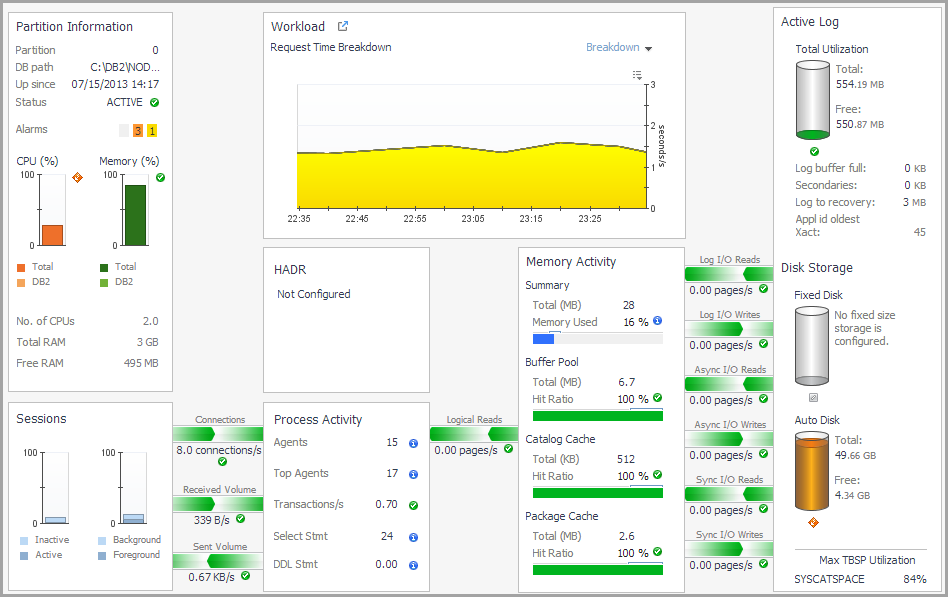
This home page provides metrics on the current state of the selected partition. It allows you to view how the partition is performing and any performance or bottleneck issues affecting the partition. Pop-ups provide additional information and graphs.
How to Get Here

1
From the Database home page, click Whole Database and select the partition you want.
2
Click Summary and select Real Time.

The following summary and drill-downs pages are provided:

SQL Performance (links to description under Database home page)
Activity Drill-downs (links to description under Database home page)
Memory Drill-downs (links to description under Database home page)
Storage Drill-downs (links to description under Database home page)
Log Drill-down (links to description under Database home page)
Configuration Drill-down (links to description under Database home page)

Summary

This home page contains the following panes:

The Member Information pane displays member status and connection information, member CPU and memory information, and member alarms. It is at the upper left of the Member (Real Time) home page.

Member. The identifying number for the partition.
DB path. The path of the partition.
Up since. The date and time the partition connected.
Status. The status of the partition.
Alarms. The alarms (due to partition irregularities) that are currently outstanding against the partition.
CPU (%). The total CPU consumption by processes running on the host (including any DB2 processes), and the total CPU consumption by the DB2 processes running on the host.
Memory (%). Total memory consumption by all processes running on the host (including DB2 processes), and the total memory consumption by the DB2 processes running on the host.
No. of CPUs. The number of CPUs allocated to the partition.
Total RAM. The total RAM allocated to the partition.
Free RAM. The total free RAM available for the partition.

Clicking the icon next to the Status displays a pop-up that provides additional, related information.

Mousing over a data point on either of the CPU or Memory charts displays a pop-up that provides additional information about the data point.

Clicking the CPU or Memory charts displays a pop-up that provides additional, related information.

Mousing over or clicking an alarm count displays a pop-up that provides additional, alarm-related information.

The Sessions pane displays the session distribution information for the selected partition. It is at the lower left of the Partition (Real Time) home page.

Inactive or Active. The distribution of currently running inactive and active sessions.
Background or Foreground. The distribution of currently running background and foreground sessions.
Connections. The current number of active connections.
Received Volume. The number of KBs per second received by the server from clients.
Sent Volume. The number of KBs per second sent by the server to clients.

Clicking a chart displays a pop-up that provides additional, related information.

The Workload Information pane for DB2 databases v9.7.0.1 and later displays a Request Time Breakdown chart for the selected partition. The Workload Information pane for DB2 databases earlier than v9.7.0.1 displays an Average Active Sessions chart for the selected partition. The pane is located in the upper middle of the Partition (History) home page.

Request Time Breakdown. The request time breakdown, for a particular partition criterion, plotted over the course of the selected time range. Click the arrow at the right of “Breakdown” to choose a different criterion from the list.
Average Active Sessions. A comparison of the average number of active sessions over the course of the selected time range with the average number of active sessions expected (according to the baseline).

Mousing over a data point on the chart displays a pop-up that provides more detailed information about the data point.

Clicking the icon next to “Workload” takes you to the Current Agents pane. For more information, see Current Agents.

If the database is configured for HADR, the HADR pane displays the associated HADR metrics for the partition. It is located in the middle of the Partition (Real Time) home page.

Role. The HADR role of the database.
HADR Remote Host. The name of the HADR remote host.
HADR Remote Instance. The name of the HADR remote instance.
Log Gap. The size (in KB) of the gap between the primary log sequence number and the standby log sequence number.
HADR State. The HADR state of the database:

Clicking the icon next to a metric displays a pop-up with additional, related information.

For more information on these parameters, see HADR Activity Collection .

The Process Activity pane displays agent and SQL information for the selected partition. It is at the lower middle of the Partition (Real Time) home page.

Agents. The number of agents for the applications currently running in the partition.
Top Agents. The maximum number of agents for all applications running in the partition.
Transactions/s. The number of transactions involving the partition that were being carried out per second, during the last collection.
Select Stmt. The number of static SQL statements that were being run per second by the partition, during the last collection.
DDL Stmt. The number of data definition language (DDL) SQL statements that were being run per second by the partition, during the last collection.

Clicking the icon next to a metric displays a pop-up with additional, related information.

The Memory Activity pane displays memory-related metrics for the selected partition. It is located in the middle of the Partition (Real Time) home page.

Memory Total (MB). The total memory available for the partition.
Memory Used. The percentage of the total memory available that was used by the database partition during the last collection.
Buffer Pool Total (MB). The total buffer pool available for the partition.
Buffer Pool Hit Ratio. The percentage of database page I/O requests that are being satisfied using the buffer cache (and therefore the database does not have to perform disk reads).
Catalog Cache Total (MB). The total catalog cache available for the partition.
Catalog Cache Hit Ratio. The number of times that a table descriptor or authorization information was not found in the catalog cache and had to be inserted there. Calculated as a percentage of the total number of times that a table descriptor or authorization information was requested, over the course of the selected time range.
Package Cache Total (MB). The total package cache available for the partition.
Package Cache Hit Ratio. The number of times that a requested section was not available for use and had to be loaded into the package cache. Calculated as a percentage of the total number of times that a section was requested, over the course of the selected time range.

Clicking a chart displays a pop-up that provides additional, related information.

The I/O activity for the selected partition is displayed in charts on either side of the Memory Activity pane.

Logical Reads. The number of logical read requests that were being processed per second by the partition, during the last collection.
Log I/O Reads. The number of logical I/O read requests that were being processed per second by the partition, during the last collection.
Log I/O Writes. The number of logical I/O write operations that were being run per second by the partition, during the last collection.
Async I/O Reads. The number of asynchronous I/O read requests that were being processed per second by the partition, during the last collection.
Async I/O Writes. The number of asynchronous I/O write operations that were being run per second by the partition, during the last collection.
Sync I/O Reads. The number of synchronous I/O read requests that were being processed per second by the partition, during the last collection.
Sync I/O Writes. The number of synchronous I/O write operations that were being run per second by the partition, during the last collection.

Clicking a chart displays a pop-up that provides additional, related information.

The Active Log pane displays metrics for the selected partition’s active log. It is at the upper right of the Partition (Real Time) home page.

Total Utilization. The total log space that is available to the partition and the log space that is still free to be used by the partition.
Log buffer full. The total number of times that agents, that copy log records into the log buffer, have had to wait for log data to be written to disk. This value is incremented once for each time an agent experiences such contention. If two agents are waiting at the same time, this value is incremented by two.
Secondaries. The total size of the secondary files (in KBs.)
Log to recovery. The size of the recovery log (in KBs).
Appl id oldest Xact. The ID of the application holding the oldest transaction.

Clicking the icon below the chart displays a pop-up with additional, related information.

The Disk Storage pane displays the disk storage status for the selected partition. It is at the bottom right of the Partition (Real Time) home page.

Fixed Storage. The total disk space that is available for use by fixed-size tablespaces and the disk space that is still free to be used by fixed-size tablespaces.
Auto Storage. The total file system space that is available for the partition to use to carry out auto storage tablespace operations, and the file system space that is still free for the partition to use to carry out auto storage tablespace operations.
Max TBSP Utilization. The maximum tablespace utilization of the system.

Clicking either of the charts displays a pop-up with additional, related information.

関連ドキュメント

The document was helpful.

評価を選択

I easily found the information I needed.

評価を選択