Using VMware Monitoring in Foglight for Storage Management
Introducing the virtual infrastructure
Navigation basics
Reference
VMware Monitoring in Foglight for Storage Management browser interface elements
Breadcrumbs
Time Range
Sortable lists
Alarms and their status indicators
Mouse-over actions
Interacting with VMware Monitoring in Foglight for Storage Management
About VMware roles
Exploring the VMWare Agent Administration Dashboard
VMware Performance Agent configuration
Rule Configuration tab
Tasks tab
User Level Access tab
Black List Tab
Agents view
Accessing the VMware Agent Administration Dashboard
Configuring monitoring agents for data collection
Investigating performance metrics
Setting the alarm sensitivity level
Additional features
VMware Performance Agent and Agent Manager configuration
Configuring agent properties
Setting the Configuration properties
Setting the FileCollector properties
Setting the vSwitchCollector properties
Setting the Duplicate VM List properties
Setting the Black List properties
Setting the Data Collection Scheduler properties
Views
Appendix: Alarm Messages
Appendix: Metrics
VMware Explorer views
Rules
FAQts tab
Resource Pools Relationship Tree view
Storage tab (Cluster)
Storage tab (Datacenter)
Storage tab (ESX Host)
Storage tab (Virtual Machine)
Summary tab
Summary (All Clusters) tab
Summary (All Datacenters) tab
Summary (All Resource Pools) tab
Summary (All Servers) tab
Summary (All Virtual Machines) tab
Virtual Infrastructure view
VMware Agent Administration views
Cluster Rules
Datacenter Rules
Datastore Rules
Resource Pool Rules
ESX Server Rules
VMW ESX Server Disk IO
VMW ESX Server Queue Latency
VMW ESX Server Queue Latency Deviation
VMW ESX Server Total Latency
VMW ESX Server Total Latency Deviation
VirtualCenter Rules
Virtual Machine Rules
VMW Virtual Machine Disk Command Aborts
VMW Virtual Machine Disk IO
VMW Virtual Machine Logical Drive Estimated Fill Time
VMW Virtual Machine Logical Drive Utilization
VMW Virtual Machine Memory Swapping
Virtual Switch Rules
VMW Distributed Virtual Switch Available Ports
VMW Distributed Virtual Switch Network Utilization
VMW Distributed Virtual Switch Packet Loss
VMW Standard Virtual Switch Available Ports
VMW Standard Virtual Switch Network Packet Loss
VMW Standard Virtual Switch Network Utilization
VMW Virtual Switch Credentials Invalid
VMware Agent Administration views
VMware Agent Administration views
The VMware Environment dashboard contains the following views:
Agents view
Figure 68. Agents view
|
1 |
On the VMware Environment dashboard, open the Administration tab. |
| |||
| |||
| |||
| |||
| |||
| |||
| |||
| |||
|
Instances and Limits view
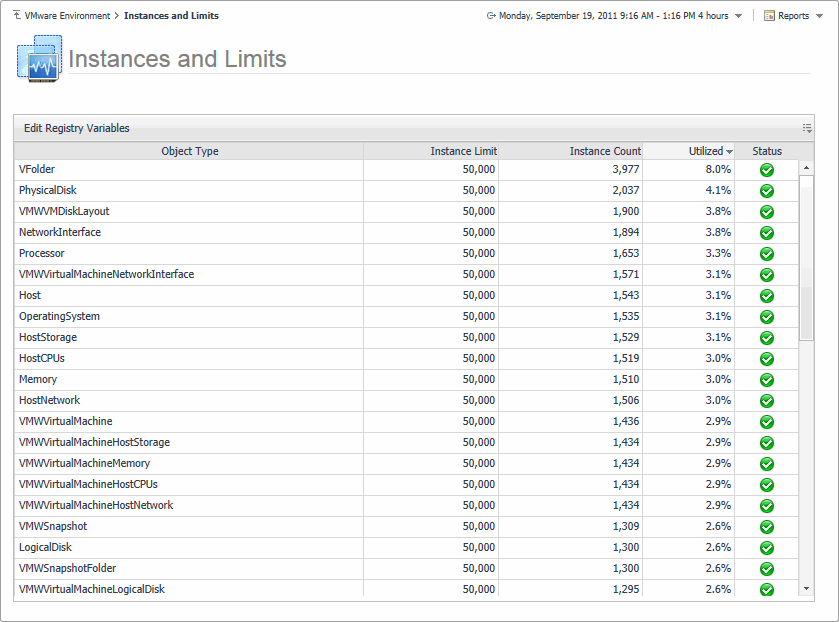
Figure 69. Instances and Limits view
|
• |
The Instances and Limits view appears in the display area.
| |||
| |||
| |||
| |||
|
OS Mapping view
Figure 70. OS Mapping view
|
• |
The OS Mapping view appears in the display area.
| |||
| |||
|


