サポートと今すぐチャット
サポートとのチャット

Foglight for VMware 5.7.7 - User and Reference Guide

Using VMware Monitoring in Foglight for Storage Management Reference Appendix: Alarm Messages Appendix: Metrics

Resource Pools Relationship Tree view

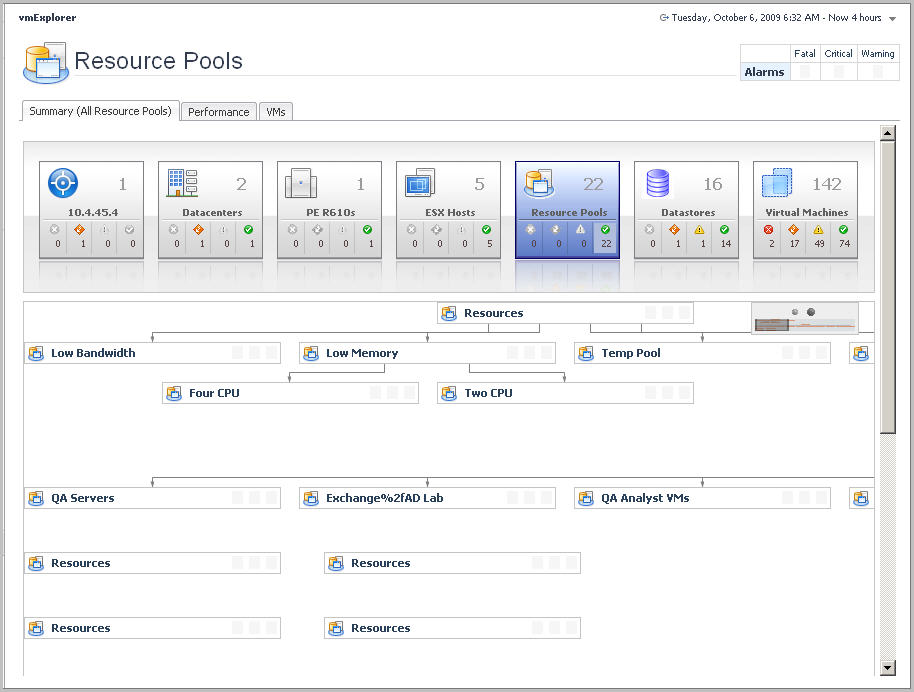
The Resource Pools Relationship Tree view is provided in the VMware Explorer dashboard. If you select a Resource Pool container from the Topology view on the Virtual Infrastructure view and click the Summary navigation tab within the VMware Explorer Primary view, a Resource Pools Relationship Tree view is displayed in the Primary view. A Resource Pools Relationship Tree contains every resource pool that belongs to the clusters within the associated VirtualCenter.

For more information about the VMware Explorer dashboard, see Investigating performance metrics .

The Resource Pools Relationship Tree view is useful if you want to see how the resource pools within the clusters are laid out or if you want to take a look at the utilization statistics for each configured resource pool on the VirtualCenter.

The default Resource Pools Relationship Tree simply displays the names of the various resource pools and their parent/child relationships.

You can use the Normal Zoom Level button on the mini map at the top right of the Relationship Tree to zoom into a more detailed version of the Tree. You can use the Minimized Zoom Level button on the mini map to zoom back out again.

You can browse through a Relationship Tree by clicking and dragging the rectangular shadow provided on the mini map.

Storage tab (Cluster)

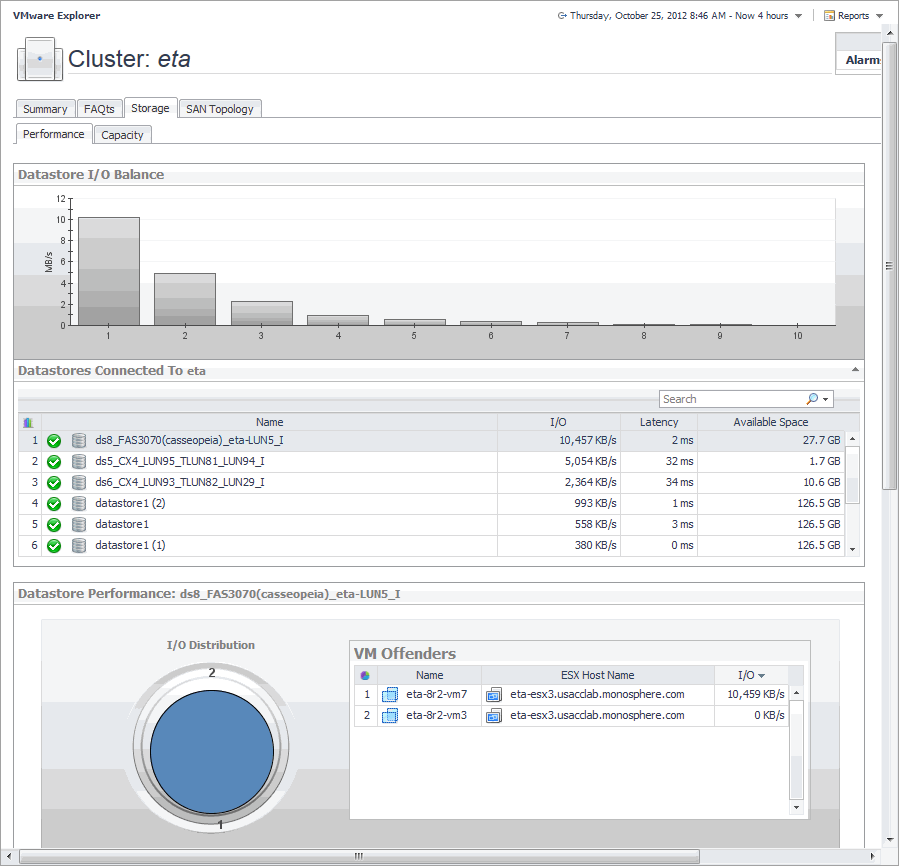
The VMware Explorer’s Storage tab displays the disk storage capacity associated with the selected component. Selecting a cluster and opening this tab displays the storage metrics associated with the selected cluster.

2
On the Virtual Infrastructure view, that appears on the navigation panel, select a cluster.

This view is made up of the following embedded views:

This view contains information about the selected datastore data capacity.

Datastore, In Use. The percentage of disk space in use.
Most Available, Available Space. The disk space available on the datastore.
Most Available, Name. The name of the datastore.
VMs On Datastore, Allocated. The amount of memory allocated to the virtual machine.
VMs On Datastore, In Use. The amount of memory used by the virtual machine.
VMs On Datastore, Name. The name of the virtual machine associated with the datastore.

This view shows the datastore capacity for each datastore connected to the selected cluster.

This view shows the data transfer rates for each datastore connected to the selected cluster.

This view lists the datastores connected to the selected cluster and shows performance metrics associated with each datastore.

Available Space. The amount of available space on the datastore.
I/O. The datastore data transfer rates.
Latency. The datastore latency.
Name. The datastore name and its alarm status.

This view lists the ESX hosts belonging to the selected cluster and associated with the selected datastore, and shows performance metrics associated with each ESX host.

Name. The ESX host name or IP address.
Read. The ESX host data read rates.
Read Latency. The ESX host read latency.
Write. The ESX host data write rates.
Write Latency. The ESX host write latency.

This view shows the data transfer rates each ESX host belonging to the selected cluster and associated with the selected datastore.

This view shows the amount I/O resources used by the virtual machines associated with the selected datastore.

I/O Distribution. A pie chart indicating how much the individual virtual machines contributed to the use of I/O resources.
VM Offenders, Name. The name of the virtual machine.
VM Offenders, ESX Host Name. The name of the ESX host on which the ESX machine is running.
VM Offenders, I/O. The data transfer rate for the virtual machine.

Storage tab (Datacenter)

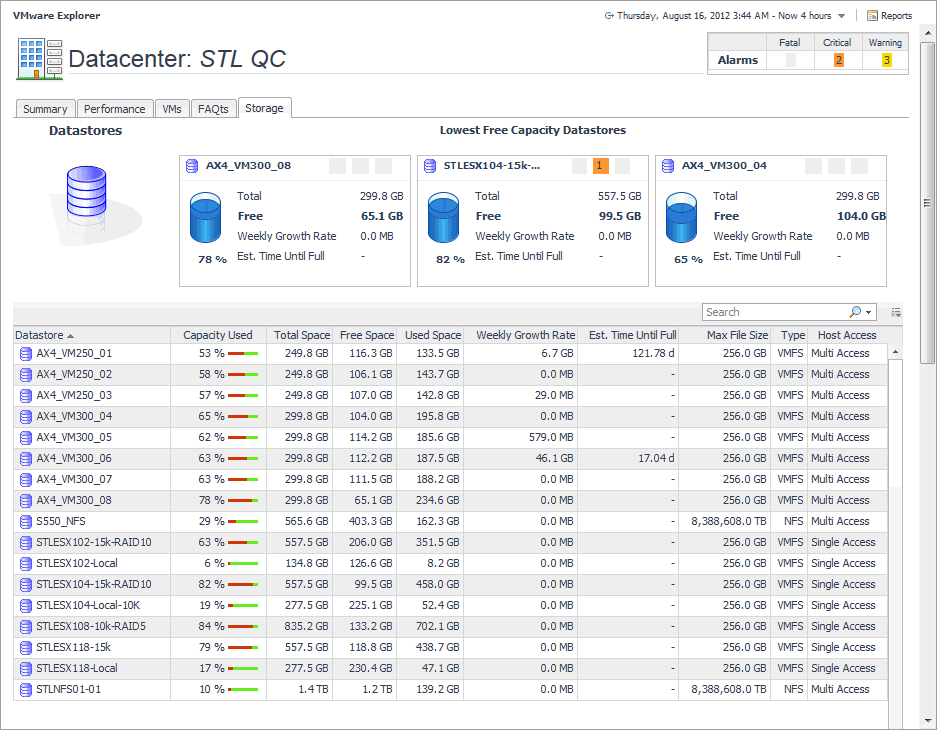
The VMware Explorer’s Storage tab displays the disk storage capacity associated with the selected component. Selecting a data center and opening this tab displays storage metrics for all Datastores associated with the selected Datacenter.

2
On the Virtual Infrastructure view, that appears on the navigation panel, select a Datacenter.

This view is made up of the following embedded views:

The Storage tab displays three tiles, identifying the datastores with the lowest amount of free space.

This view contains information about the used, free, and total space of the selected components’s datastores, along with projected short-term estimates, given the current growth patterns.

Datastore. The name of the selected datastore, followed by the related alarm counts.
Est. Time Until Full. The estimated amount of time until which this datastore will become full.
Free. The amount of free space for this datastore.
Total. The total amount of space for this datastore.
Weekly Growth Rate. The average amount of space the datastore expands every week.
Table 15. Datastores

Lists the datastores associated with the selected datacenter, and shows storage metrics associated with each datastore.

Capacity Used. The current percentage of the used disk space.
Datastore. The datastore name.
Est. Time Until Full. The estimated time after which the disk will be full.
Free Space. The amount of disk space that is free.
Host Access. The host access type.
Max File Size. The maximum file size.
Total Space.The total disk space, including used and free space.
Type. The file system type.
Used Space. The amount of used disk space.
Weekly Growth Rate. The estimated growth pattern of the used disk space.

Storage tab (ESX Host)

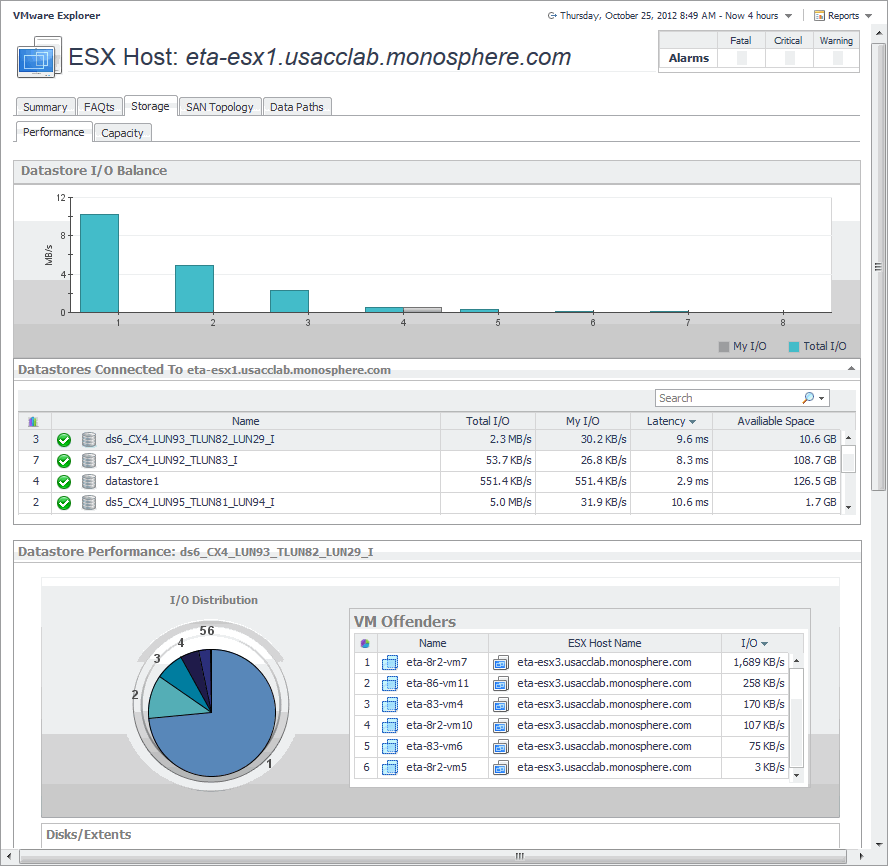
The VMware Explorer’s Storage tab displays the disk storage capacity associated with the selected component. Selecting an ESX host and opening this tab displays the storage metrics associated with the selected ESX host.

2
On the Virtual Infrastructure view, that appears on the navigation panel, select an ESX host.

This view is made up of the following embedded views:

This view contains information about the selected datastore data capacity.

Datastore, In Use. The percentage of disk space in use.
Most Available, Available Space. The disk space available on the datastore.
Most Available, Name. The name of the datastore.
VMs On Datastore, Allocated. The amount of memory allocated to the virtual machine.
VMs On Datastore, In Use. The amount of memory used by the virtual machine.
VMs On Datastore, Name. The name of the virtual machine associated with the datastore.

This view shows the datastore capacity for each datastore connected to the selected ESX host.

This view shows the data transfer rates for each datastore connected to the selected ESX host.

This view shows a the amount I/O resources used by the virtual machines associated with the selected datastore.

Disks/Extents, Name (VMFS and NFS datastores only). The name of the disk associated with the datastore. For more information about VMFS and NFS datastores, see Datastores .
Disks/Extents, Read (VMFS and NFS datastores only). The rate at which the data is read from the disk.
Disks/Extents, Read Latency (VMFS and NFS datastores only). The read latency of the disk.
Disks/Extents, Write (VMFS and NFS datastores only). The rate at which the data is written to the disk
Disks/Extents, Write Latency (VMFS and NFS datastores only). The write latency of the disk.
I/O Distribution. A pie chart indicating how much the individual virtual machines contributed to the use of I/O resources.
VM Offenders, Name. The name of the virtual machine.
VM Offenders, ESX Host Name. The name of the ESX host on which the ESX machine is running.
VM Offenders, I/O. The data transfer rate for the virtual machine.
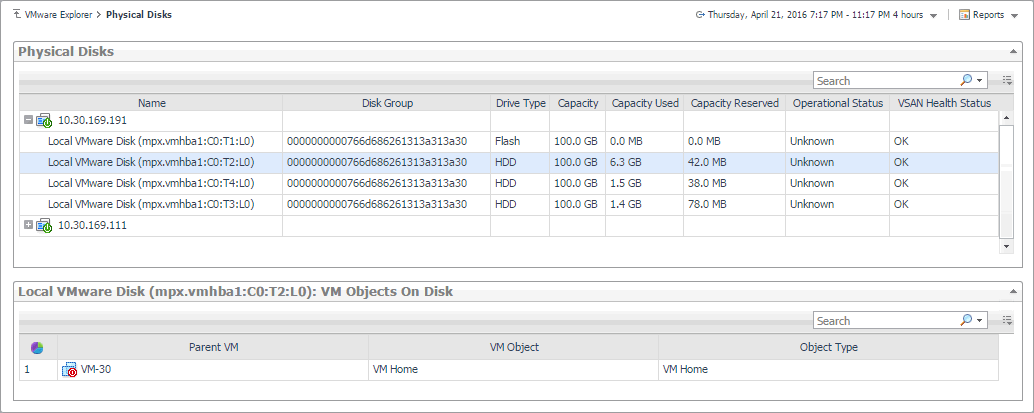
Vsan Disks (VSAN datastores only). Click Explore Physical Disks view to display the more information about physical disks.

This view lists the datastores connected to the selected ESX host and shows performance metrics associated with each datastore.

Available Space. The amount of available space on the datastore.
Latency. The datastore latency.
My I/O. The datastore data transfer rates associated with the selected ESX host.
Name. The datastore name and its alarm status.
Total I/O. The total datastore data transfer rate.

This view shows the data transfer rates for each storage adaptor associated with the selected ESX host.

This view lists the storage adaptors associated with the selected ESX host, and shows performance metrics for each adaptor.

Name. The storage adaptor name.
Read. The storage adaptor data read rates.
Read Latency. The storage adaptor read latency.
Write. The storage adaptor data write rates.
Write Latency. The storage adaptor write latency.
関連ドキュメント

The document was helpful.

評価を選択

I easily found the information I needed.

評価を選択