Monitoring your PowerVM environment
You can monitor the performance of PowerVM® servers, PowerVM partitions, and PowerVM Virtual I/O servers on the Monitoring tab of the Infrastructure Environment dashboard. The information appearing on this dashboard can tell you how well the selected monitored objects are performing given the current workload, and to discover potential resource-level issues, typically indicated by higher than usual processor, memory, and disk storage usage. This allows you to pro-actively reallocate resources where they are most needed, and to prevent service interruptions before they happen.
Exploring the Infrastructure Environment dashboard
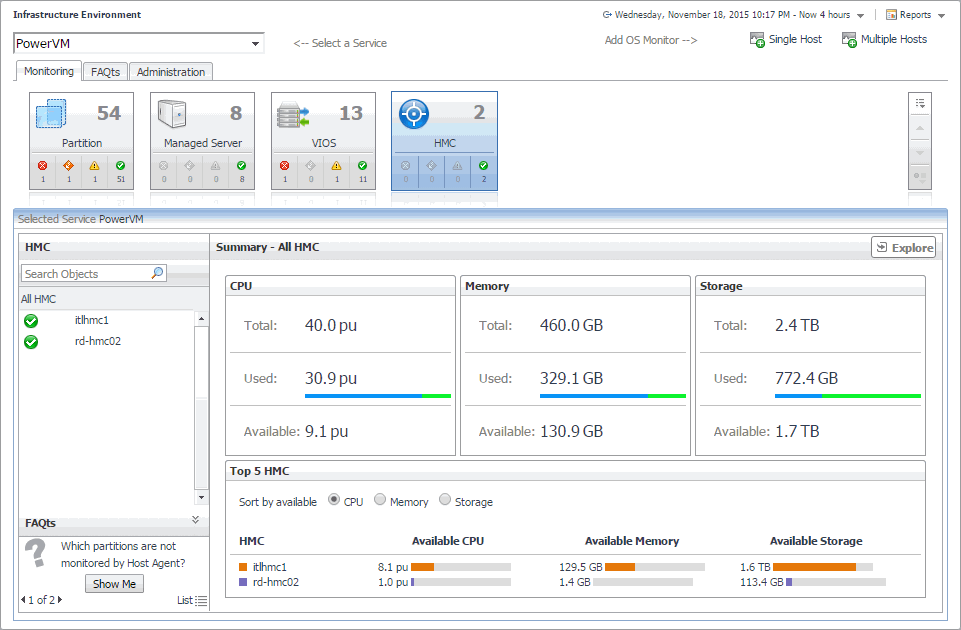
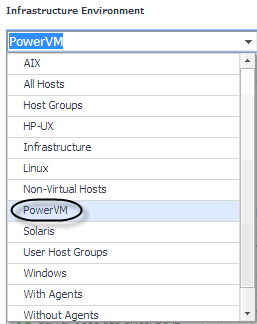
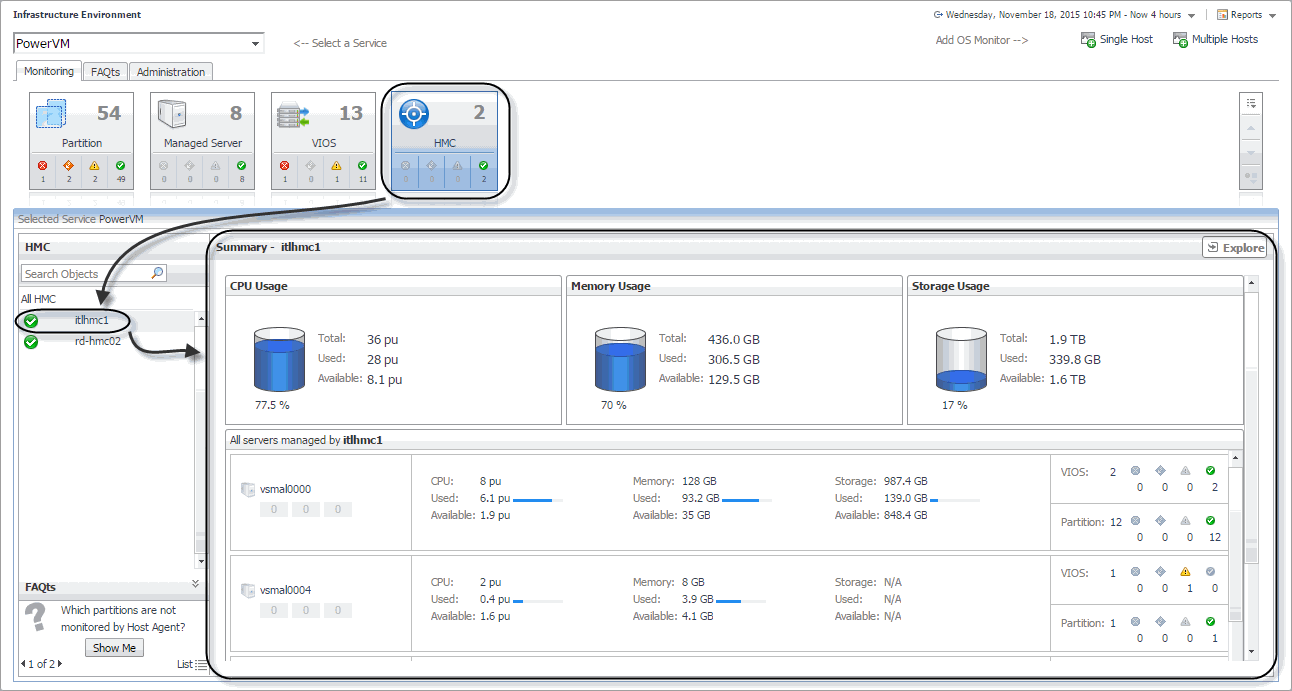
A typical PowerVM® environment includes one or more HMC instances, managed PowerVM servers, PowerVM partitions, and PowerVM Virtual I/O server (VIOS) instances. You can view the state of these components on the Infrastructure Environment dashboard when you select the PowerVM service.
The Monitoring tab displays main components of your monitored PowerVM infrastructure such as HMC instances, managed servers, partitions, and VIOS instances. When you navigate to the Infrastructure Environment dashboard and select the PowerVM service for the first time, the Monitoring tab appears open.
|
2 |
|
4 |
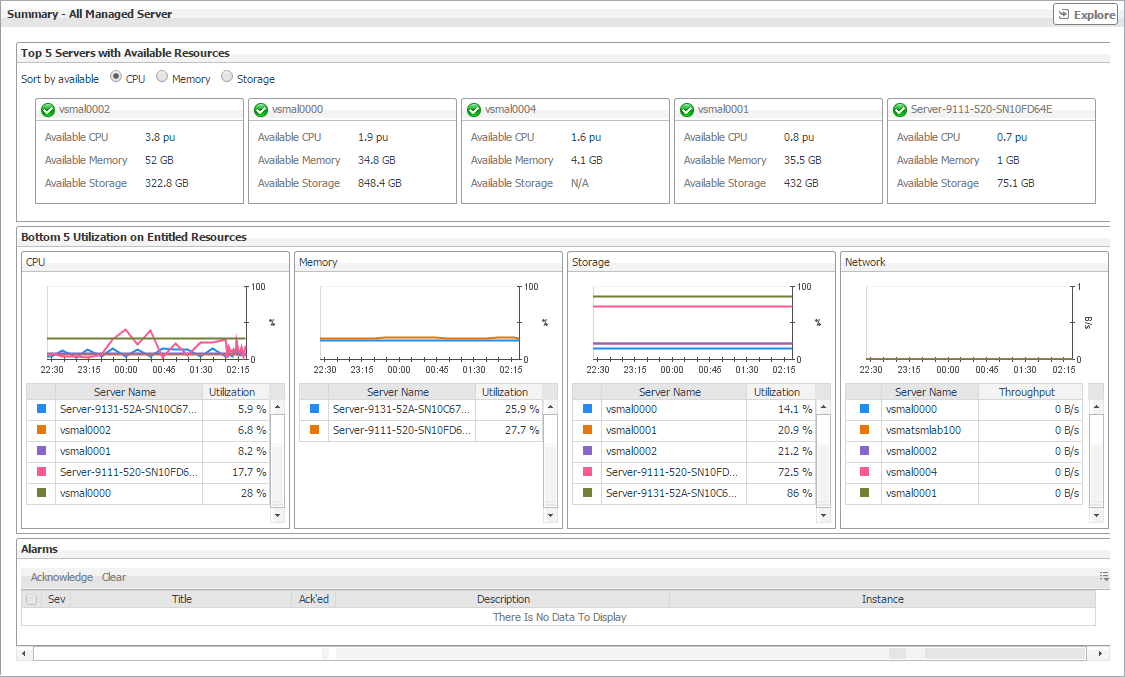
On the Infrastructure Environment dashboard, on the Monitoring tab, click a tile representing the object type that you want to investigate. |
|
5 |
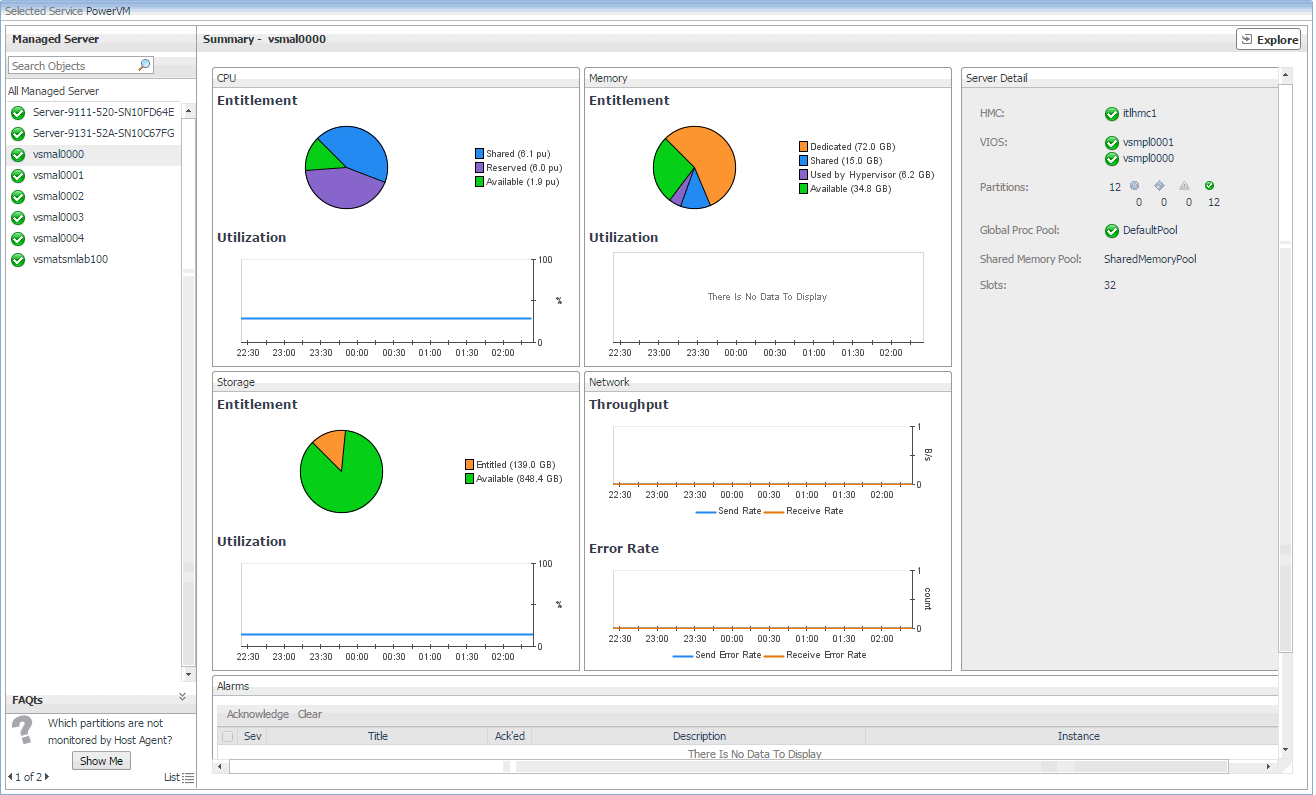
In the Managed Server view on the left, select an object instance from the list. |
Selecting monitored objects
The Selected Service PowerVM view appearing immediately below the tiles allows you to select a specific instance of the tile selection. From here, you can drill down on a desired object instance, and review the metrics associated with the selected object.

