Replicated Servers Metrics
|
• |
DB: The replicated server database name. |
|
• |
Latency (sec): The difference between the time the transaction was committed at the destination (Replicate) database, and the time at the origin (Primary Site) when the transaction was committed, in seconds. |
Databases Dashboard
At the top of this dashboard you see the total counts of all alarms generated by all monitored database types, including SAP ASE. The alarm counts are grouped by the severity level: Fatal, Critical, Warning, Normal, and Unknown. Use this as a starting point to quickly estimate potential bottlenecks within your infrastructure.
|
NOTE: The flows associated with the Discover more databases and Administer Agents buttons, appearing in the top-right are only available when you are monitoring SQL Server and Oracle databases and have Foglight for SQL Server and Foglight for Oracle installed. For more information, see the Managing Oracle Database Systems User Guide and Managing SQL Server Database Systems User Guide. |
Just below the alarm counts, a collection of tiles displays a high-level overview of your environment. Each tile represents a database type (All, SQL Server, Oracle, SAP ASE, DB2) and shows how many database instances exist in your monitored environment, along with the count of objects of that type in each of the alarm states (Normal, Warning, Critical, Fatal).
The table of database instances appearing just below the tile collection reflects the tile selection. For example, clicking the SAP ASE tile shows only the SAP ASE databases in the list.
For details about the information appearing in this list, see Viewing the list of database instances .
You can use other types of attributes to filter this list. For example, clicking a severity icon in a tile shows only the database instances of that database type that are in that alarm severity state. For more information about filtering this list, see Filtering the list of database instances .
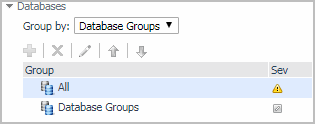
In many cases it may be useful to create one or more groups of databases that you want to monitor. You can use database groups to further filter your selection using the Databases view appearing on the navigation panel.
For additional information about database groups, see Managing database groups .
Clicking the All tile shows a list of all monitored database instances. Clicking any value in the database list, except the Home icon in the Name column, displays a Sybase cue card at the bottom of the display area, showing additional information about the selected database instance. For details about the information appearing in this view, see Exploring the state of selected database instances .
Clicking the Home icon in the Name column links to the MDA Home Page Dashboard.
Viewing the list of database instances
The table of database instances can display all available database instances, or a filtered list. For more information about possible filters, see Filtering the list of database instances .
Filtering the list of database instances
|
• |
To list only the database instances that belong to a specific database group, on the navigation panel, in the Databases view, expand the Database Groups node and select a group. For more information about database groups, see Managing database groups . |


