Virtual Machine Summary view
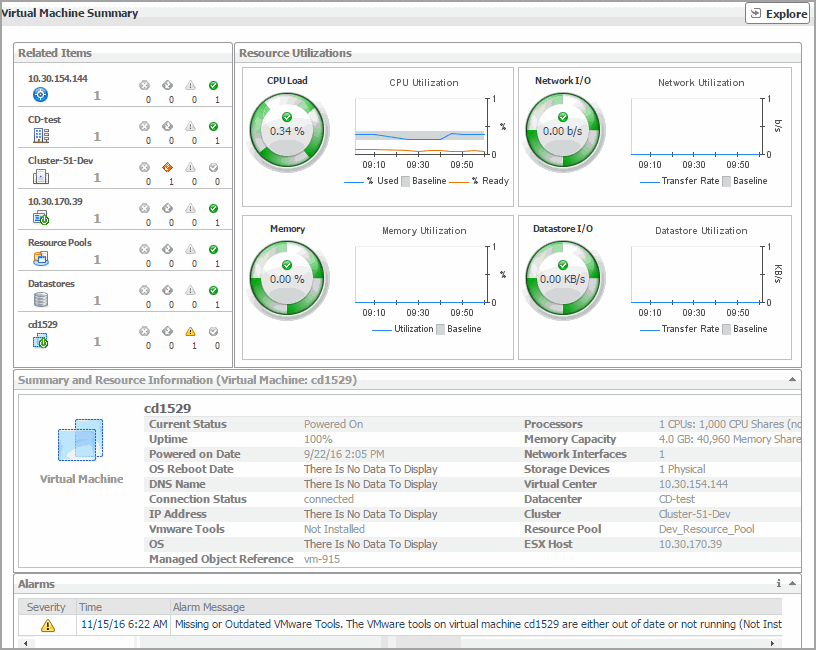
The Virtual Machine Summary view shows the overall resource utilization and the amounts of system resource consumption for a virtual machine.
|
1 |
On the VMware Environment dashboard, on the Monitoring tab, in the Virtual Environment Overview, select the Virtual Machines tile. |
|
2 |
This view is made up of the following embedded views:
|
• |
|
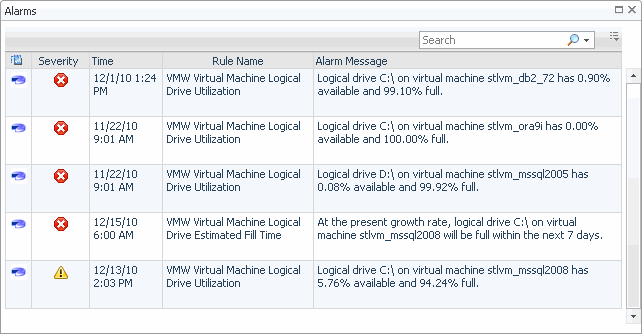
Lists the alarms generated against the selected virtual machine. | |||
| |||
| |||
| |||
|
|
Lists the summary and resource information of the selected virtual machine. | |||
| |||
| |||
| |||
| |||
| |||
| |||
| |||
| |||
| |||
| |||
| |||
| |||
| |||
| |||
| |||
| |||
| |||
| |||
|
| |||
| |||
| |||
| |||
| |||
| |||
| |||
| |||
| |||
| |||
| |||
| |||
| |||
| |||
|
|
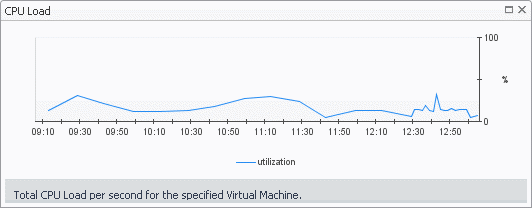
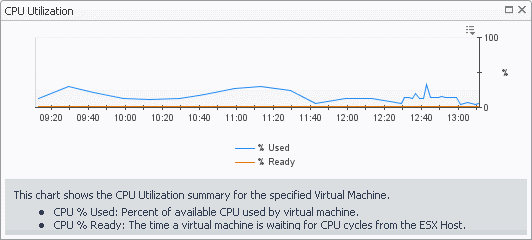
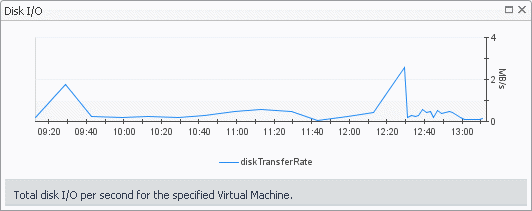
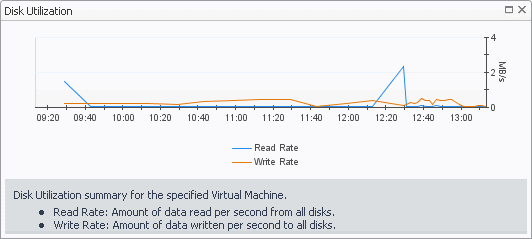
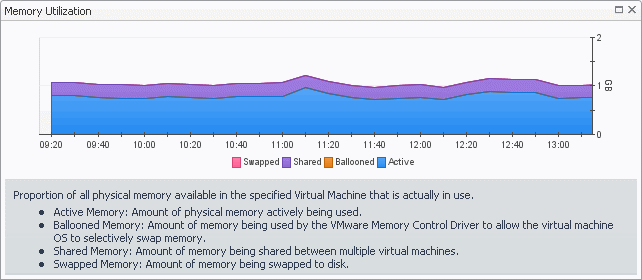
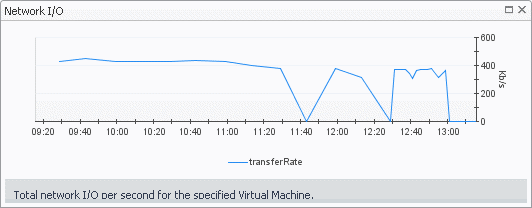
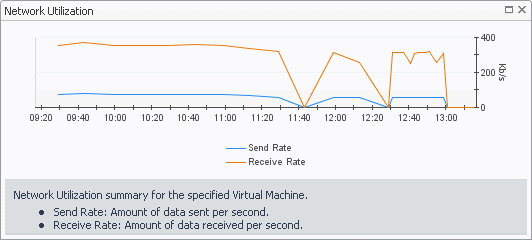
Shows the resource consumption for the selected virtual machine broken down into four simple views. | |||
| |||
| |||
| |||
| |||
| |||
| |||
| |||
| |||
| |||
| |||
| |||
| |||
| |||
| |||
| |||
| |||
| |||
| |||
| |||
|
Summary - All Virtual Machines view
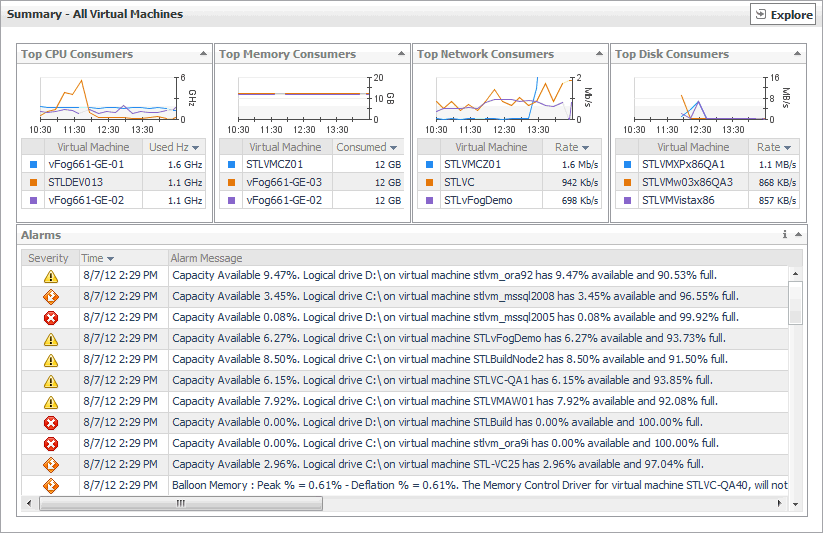
The Summary - All Virtual Machines view displays overall resource utilization information for a group of virtual machines and shows the elements that consume the highest amount of system resources.
|
1 |
On the VMware Environment dashboard, on the Monitoring tab, in the Virtual Environment Overview, select the Virtual Machines tile. |
|
2 |
This view is made up of the following embedded views:
|
• |
| |||
| |||
| |||
|
|
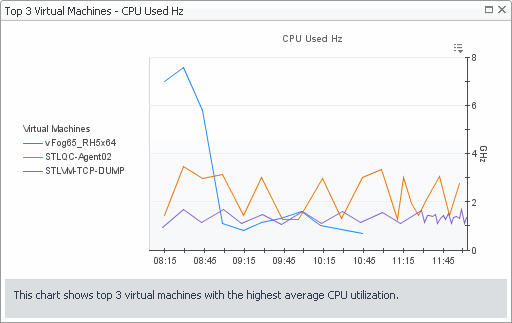
Shows the top three virtual machines with the highest average CPU utilization. | |||
| |||
| |||
|
|
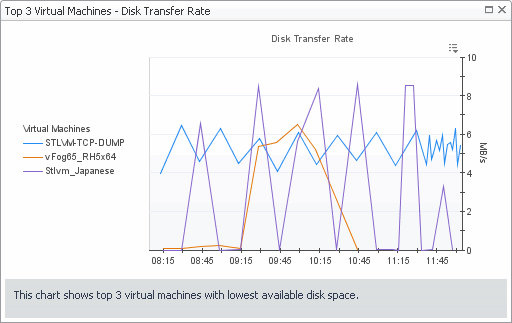
Shows the top three virtual machines with the lowest available disk space. | |||
| |||
| |||
| |||
|
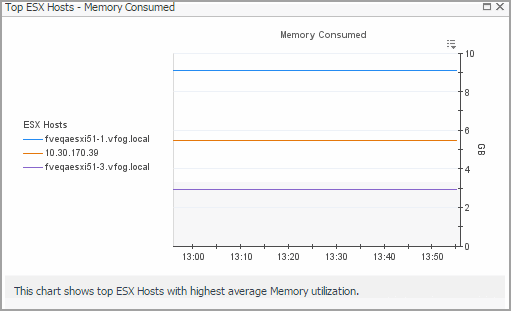
Shows the top three virtual machines with the highest average memory utilization. | |||
| |||
| |||
| |||
|
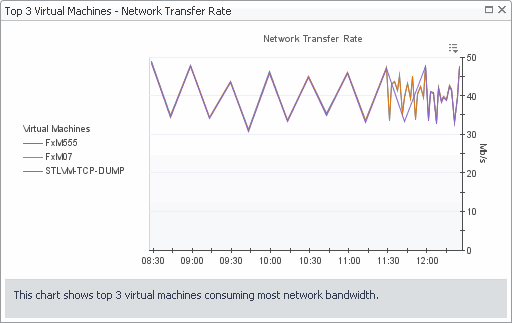
Shows the top three virtual machines that are consuming most network bandwidth. | |||
| |||
| |||
| |||
|
Virtual Machines view
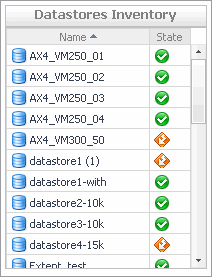
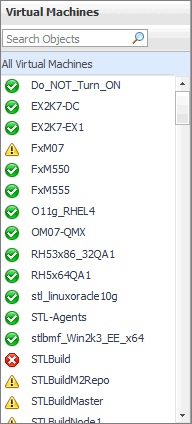
This view is a tree view. It lists the virtual machines that exist in your environment and shows their state.
Selecting the All Virtual Machines node displays overall resource utilization for all virtual machines in your integrated system, and the elements that consume the highest amount of system resources in the Summary - All Virtual Machines view on the right. Similarly, selecting a Virtual Machine node shows Virtual Machine-specific metrics in the Virtual Machine Summary view view on the right.
|
• |
On the VMware Environment dashboard, on the Monitoring tab, in the Quick-View, select the Virtual Machines tile. |
| |||
| |||
| |||
| |||
|
Summary - Standard Virtual Switch view
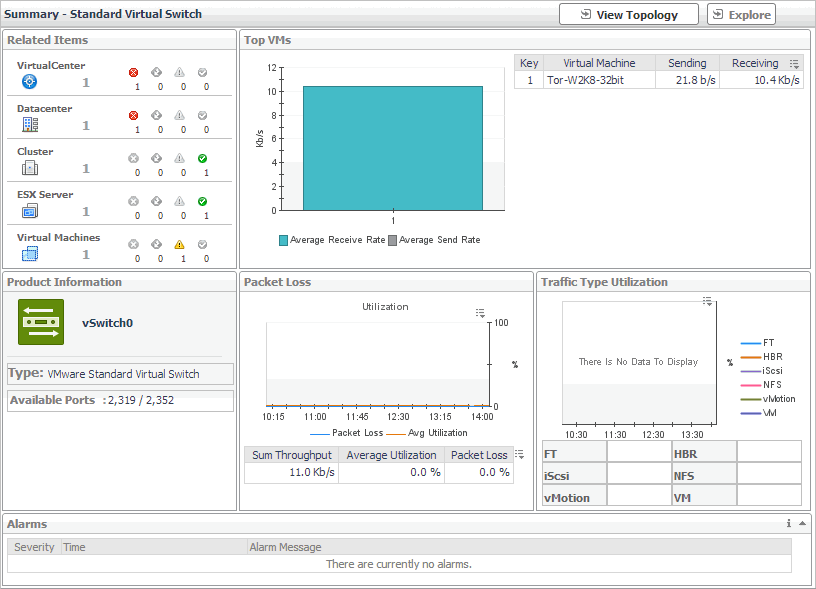
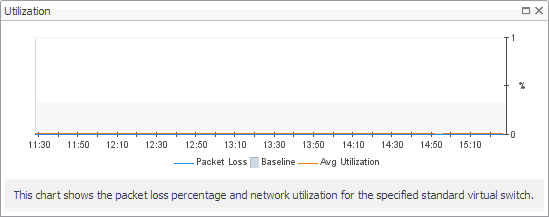
The Summary - Standard Virtual Switch view illustrates the overall network utilization and the levels of overall network packet loss for a selected standard virtual switch.
|
1 |
On the VMware Environment dashboard, on the Monitoring tab, in the Virtual Environment Overview, select the Virtual Switches tile. |
|
2 |
In the Quick-View, in the Virtual Switches view, under Standard Virtual Switches, select a virtual switch. |
This view is made up of the following embedded views:
|
• |
|
• |
|
Lists the alarms generated against the selected virtual machine. | |||
| |||
| |||
| |||
|
| |||
| |||
| |||
| |||
| |||
|
|
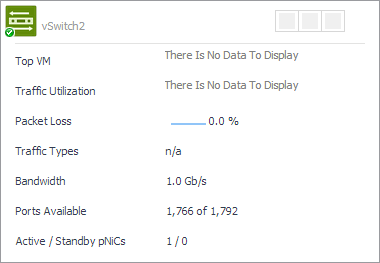
Shows the name of the selected switch along with some basic configuration information. | |||
| |||
| |||
|
|
Shows the numbers and states of the objects in your environment associated with the selected switch. | |||
| |||
| |||
| |||
| |||
| |||
| |||
| |||
| |||
|
|
Identifies the virtual machines with the highest network transfer rate. | |||
| |||
| |||
| |||
| |||
| |||
|
| |||
| |||
| |||
| |||
| |||
| |||
|

