Configuration details
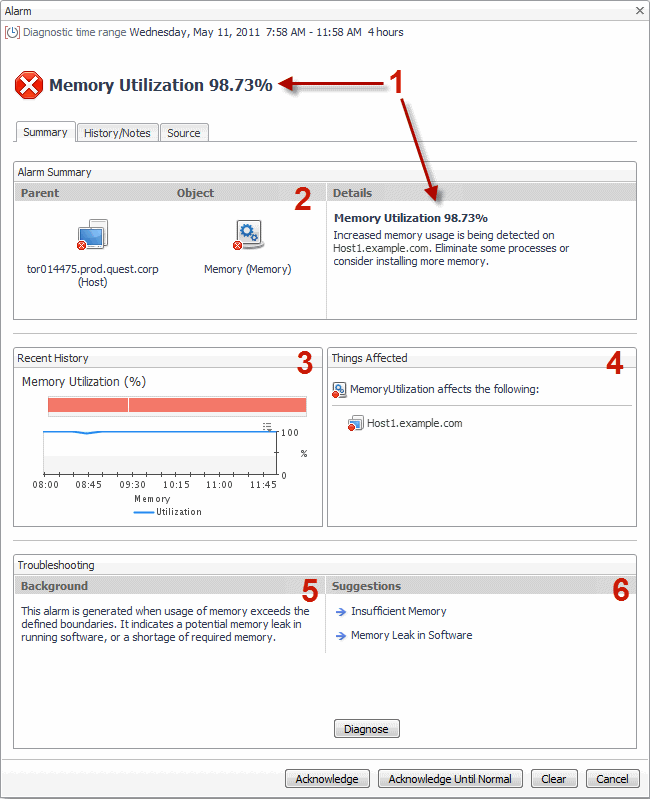
The following diagrams indicate the components of the Alarm dialog box that need to be configured in the alarm association. Use the guidelines provided below when configuring these components in an alarm association.
|
2 |
The object in this image is the topologyObject property of the alarm. If the object does not have a parent (if it is the Domain Root, which is the parent that appears), then only that object appears in the centre of the space. |
|
3 |
The Recent History view is the view to which the Small Detail View property is mapped. There is no default if this is not specified. The space allows for a small detail view whose height should be no more than 130 px. |
|
4 |
The elements affected here are determined by the parents and services to which the topologyObject belongs. |
|
6 |
These diagnostics are customizable associations. You must provide a name and description for each. It is best to provide a few diagnostics, but too many can result in an overhead and as such be counter-productive. The Diagnose button takes its view from the Diagnosis property. If none is provided, the button does not appear. This property is optional. |
|
7 |
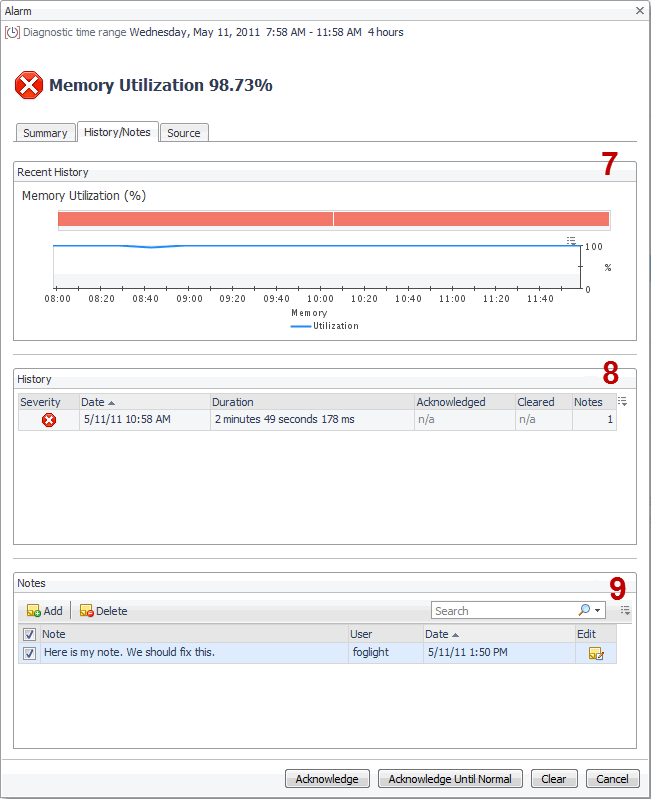
The Recent History view on the History/Notes tab is the view to which the Large Detail View property is mapped. It has similar height restrictions to the Small Detail View (130 px, see Step 3), but can be wider. This can be the same view as the Small Detail View, or a different view containing alarm metrics. The contents of the selected view should be compatible with the title (Recent History). In cases where the small view is flexible then the view to which the small view is mapped can be mapped to the large detail view as well. The large view should also be compatible with the title (Recent History). |
|
8 |
The History table is the standard list containing alarm instances, and appears by default. |
|
9 |
The Notes table is the standard list containing user-defined notes, and appears by default. |
|
10 |
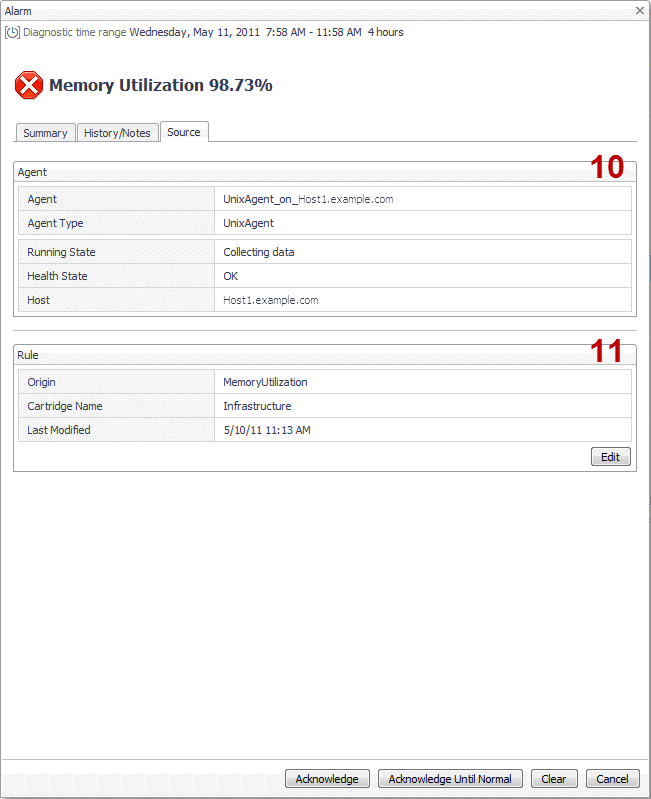
On the Source tab, the Agent and Agent Type entries in the Agent view contain the agent name and its type, and appear by default. The section containing the Running State, Health State, and Host entries also appears by default, and can be replaced by setting the Agent Detail View property. To populate this view, ensure that the agent is set as the monitoring agent for each entity it monitors. |
|
11 |
The Rule view appears by default. |
Configuration example
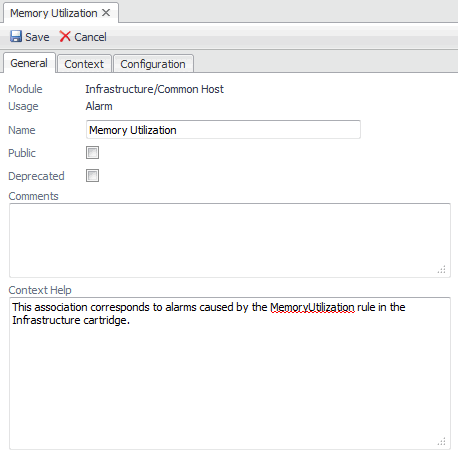
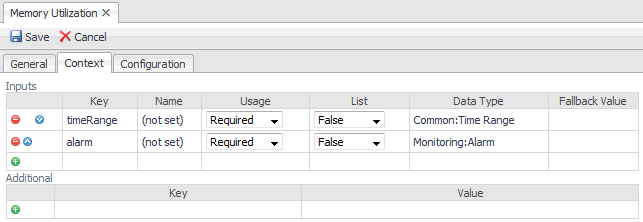
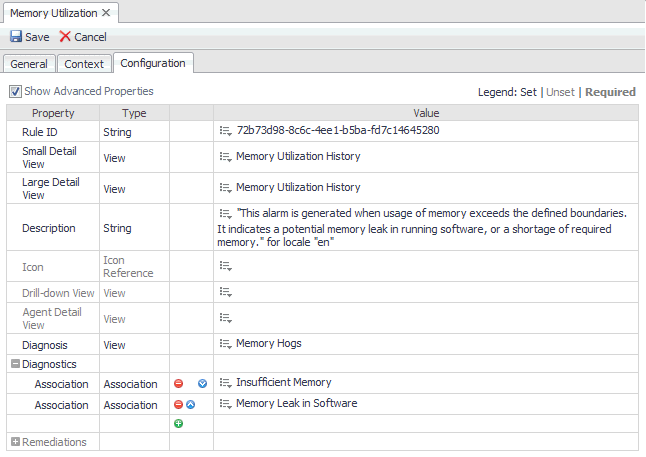
The following images show a sample configuration of an alarm association.
|
The Small Detail View maps to the Recent History view appearing on the Summary tab. The Large Detail View maps to the Recent History view appearing on the History/Notes tab. This example contains a mix of required and optional settings. Not all of the optional settings are set. For example, the Agent Detail View property is not set, which results in the Agent view showing the default entries. |
Renderers
At runtime, how data in a Foglight® dashboard displays depends on which renderers are set in the view definition and which renderer has been mapped to a data value's type, property, or unit. Renderers can be mapped to types and properties in the Types tab or to units in the Units tab. Mapped renderers are looked up automatically at runtime if no specific renderer has been set in the view definition.
Default Renderer can be Overridden
|
2 |
Select the Renderers tab in the Module Contents pane. |
|
3 |
|
4 |
In the General tab, give the new renderer a name and supply an appropriate description. |
|
5 |
Select the Configuration tab and set the appropriate properties for the new renderer. |
|
6 |
Click Save. |
|
2 |
Select the Types tab in the Module Contents pane. |
|
3 |
Click the Add button. |
|
5 |
Select its Renderers tab. |
|
7 |
In the Renderer drop-down list, select from the Available Renderers dialog box the renderer that you defined previously. Click Save in the dialog box. |
|
8 |
Click Apply in the editor pane. |
|
9 |
Click Save. |

