-
Titolo
How to master SQL Server performance baselining to avoid false positives and/or missing alerts -
Risoluzione
Baselining SQL Server metrics have significant advantages over traditional predefined alert thresholds when monitoring SQL Server performance. What’s more, when tracking some wait types statistics, it is a must have as there is no other way to interpret collected performance data correctly otherwise. A good start on how to detect performance issues in a real-world situation is the How to detect SQL Server performance issues using baselines – Part 3 article. However, to be able to learn how to use performance baselining and to understand its full potential some advanced knowledge will be presented first
SQL Server baselining challenges and required knowledge
Creating an adequately established performance baseline is one of the toughest jobs, and therefore baselining is mainly reserved for skilled and experienced SQL Server DBAs. While essential and irreplaceable in many situations, performance baselining must be handled with care and knowledgeable. Before jumping into any SQL Server performance baselining, the DBA must develop certain skills and gather some in-depth knowledge:
- Good knowledge and understanding of SQL Server’s underlying hardware, in particular, CPU, physical memory, and related I/O subsystems (especially relations between the physical memory and the I/O subsystems)
- More in-depth knowledge of underlying Windows operating system (in most cases Server versions)
- In the case of a system based on virtualization, knowledge of hypervisor software, host machine and its virtual machines operating system, including the knowledge on relations between those three virtualization components
- Profound knowledge of SQL Server internals like locking, spinlocks, latches, blocking and wait statistics
- Knowledge of how to configure and change SQL Server configuration parameters in accordance with performance requirements
- Knowledge of how to configure and implement changes in underlying Windows OS depending on SQL Server performance requirements
- Thorough knowledge of database design
- Good understanding of database applications, and workloads that database applications impose to database
Any system change imposed in any of the above categories could lead to an entirely different set of data, potentially making the created baselines useless. Using the various improvised solutions for collecting SQL Server data and calculating baselines are often inherently difficult to fine tune and if not handled carefully, often can create problems instead of solutions.
The goal of SQL Server baselining
SQL Server can be looked at as a live organism that reacts on external and internal variables in sometimes different and not always predictable ways. This can wind up making hard to understand the performance limits of SQL Server and what is the “normal” SQL Server state. A proper baseline should be the set of calculated threshold values that reflect the “normal” SQL Server workload, and it serves to prevent or reduce false alerts in SQL Server that is exposed to workload fluctuations
However, establishing a proper SQL Server performance baseline is not the goal in and of itself. The goal of establishing the limits of “normal” SQL Server workload is determining more precisely what can be considered as an “abnormal” SQL Server workload, as only by knowing well what is normal for SQL Server it is possible to understand what is abnormal
Having that in mind, it is important to know the following SQL Server performance hallmarks:
- The normal workload – the range of SQL Server workload that allows optimal SQL Server performance during the everyday work. The normal workload information is something that is available during the regular SQL Server work and can be determined as a period where SQL Server regular workload does not cause any SQL Server performance issues. It is something that is used as a basis for baseline calculation
- The high-water mark – the high-water mark presents the workload peaks of SQL Server that still allows SQL Server to work without degradation or within the acceptable/expected degradation scope. The high-water mark is not something that can be established from reviewing everyday SQL Server workload. For establishing high-watermarks in SQL Server performance, the specific load test on SQL Server should be executed in a way that allows determining performance peaks that are still acceptable
- The maximum workload – the maximum SQL Server workload imposed over an unlimited time that still allows SQL Server to work without degradation or within the acceptable/expected degradation scope. The same as the high-water mark, the maximum workload can be determined only using the specific load tests that help to determine what the maximum continuous workload that can be imposed on SQL Server is
The latter two, high-water mark and maximum workload, are often disregarded categories as establishing either of those two is time and resources intensive work that requires executing a set of carefully created tests. Moreover, while creating a baseline based on the normal workload can satisfy DBAs needs in many cases, the maintenance of serious enterprise graded systems would require all three aspects to be taken in calculation when creating the performance baselines. The close to “ideal” baselines can be created only by having the data from all three mentioned performance parameters
Creating the proper SQL Server performance baseline
The preferred scenario to create a baseline is to have a historical period with data for calculation, where collected SQL Server metric data are on the verge of what is to be considered as “good” values. That means that collected data are from the period when SQL Server performance is not affected in any case. Theoretically, that allows threshold calculations based on standard deviations to meet the sweet points of the boundaries between the normal and abnormal SQL Server performance.
However, having and collecting SQL Server metric data with “ideal” values is rarely possible in real world. That is why having the insight in the normal workload, high-water mark, and the maximum workload is important. While baseline calculation based on the normal SQL Server workload metric data could help us to understand and to interpret SQL Server behavior when workload without significant ups and downs is imposed on SQL Server, it is also important to be aware that such a baseline is not something that guarantees the best results.
Sometimes, the business or end user requirements imposed could be stricter in setting the expectations on SQL Server that some operations must be executed faster or SQL Server responsiveness must be higher in some cases. Some examples are:
- A SQL Server maintenance period cannot be longer than 30 minutes
- SQL Server must return data to then end user in less than 5 seconds with up to 100 users producing simultaneous workload
- Transaction log backup must be created every 2 hours and must complete within 5 minutes
- No SQL Server blocking when continuously handling 700 batch request/second
- A data retention policy of one year
Having such precise requirements imposed on SQL Server allows DBA to understand the performance expectations and end-user needs correctly and to built-in those into the resulting baseline calculations
Interpreting the baseline data
When working with baselines, there is a constant pressure imposed to interpret the data and the calculated baseline correctly or to perform a recalculation of the baseline from time to time when “better” values are collected. Therefore it is important to have insight and awareness of the baseline calculation methodology, statistical data behind the calculations such as the min and max values, baseline average (mean), standard deviations and other necessary parameters
It is true that the longer the time span used for the baseline calculation is, the more accurate the resulting baseline could be, but even then there is no guarantee that calculated baseline can hit the target and provide acceptable results. As a consequence, the DBA may face a situation to either deal with excessive alerting, or even worse the situation with no alerts even after SQL Server performance suddenly degraded. In the first case, due to the high number of alerts, it is impossible to distinguish real from false-positives in the context of performance problems. In the second scenario, the DBA is not even aware of any performance problems until they occur due to missing notifications about underlying issues issues.
So, mastering SQL Server baselining, on its own, requires specific skills and in-depth knowledge possessed only by more advanced/experienced DBAs. Moreover, even for them, surviving everyday urgent problems, additional requirements imposed and ad-hock requests by end users could leave them with a very little or no time for this critical skill. That is why the most DBAs are reaching for the third party performance monitoring solutions, such as ApexSQL Monitor, where intelligent SQL Server performance baselining is an integral part the tool.
Performance baseline with ApexSQL Monitor
The basics covering baselining with ApexSQL Monitor can be found in the article How to detect SQL Server performance issues using baselines – Part 3 where some best practice scenarios are explained. The scope of this article is to provide a solution to some real-world use cases where some additional advanced actions are required be taken. To deal with such use cases, ApexSQL Monitor has improved baselining that allows customization of the calculated baseline to meet concrete demands to reduce false positive alerts, or no alerting situations. More about the feature itself and how to use it correctly, as well as the information about how ApexSQL Monitor calculates performance baselines can be found in the How to customize the calculated SQL Server baseline threshold article.
The target of this particular article is to explain how to deal with use cases described using ApexSQL Monitor to get the best results in the performance monitoring of SQL Server.
Collected metric data values are much lower than SQL Servers capacity
It is not an atypical situation where a baseline calculation is based on lower values compared to what SQL Server is capable of handling. As a rule, this can lead to situations where frequent and even excessive false-positive alerts can be encountered. To explain this scenario more precisely, a practical use case with one of the most widely tracked metrics “utilization of processor time”, will be used as an example, but this is also valid for most performance metrics.
Today, hardware is getting more powerful, where the power and speed of modern CPUs are something unimaginable just a few years ago. Incorporating up to date, state of the art hardware is usually not something that is projected to deal with current or short-term demands, but as a medium to a long-term solution that should be able to cope with ever-increasing demands imposed to the SQL Server in the future. Moreover, having modern hardware, much stronger than the installed SQL Server requirements are, means that the CPU in this particular case runs at a margin that is way below its real potential
In the image above, a typical day where the CPU is continually running below the 25% is shown, which means that there is a significant margin, in this particular case, for imposing a much higher load on the CPU without any suffering any performance consequences. When calculating the baseline for such values, the result is something that we can see in the next image
So, as it can be seen, medium and high baseline thresholds are set below 25%, just occasionally reaching that level. As any SQL Server is designed to be utilized optimally and cost-effectively, it is normal to expect applications that utilize SQL Server to evolve over the time as well as the end users’ needs, thus inevitably causing a higher consumption of CPU, but other hardware resources as well. This would lead to the number of alerts increasing over the time without actually impacting SQL Server performance
In the example above, CPU utilization jumped close to 50% in a part of the day, causing a situation where alerts are triggered even the SQL Server performance is not affected at all
To handle that scenario the calculated threshold can be edited to accommodate the higher metric reading to fit the area below the alert thresholds without the need for performing full baseline recalculation
- Click on the Configuration link in the main menu
- Select Baselines in the submenu to open the baseline configuration page
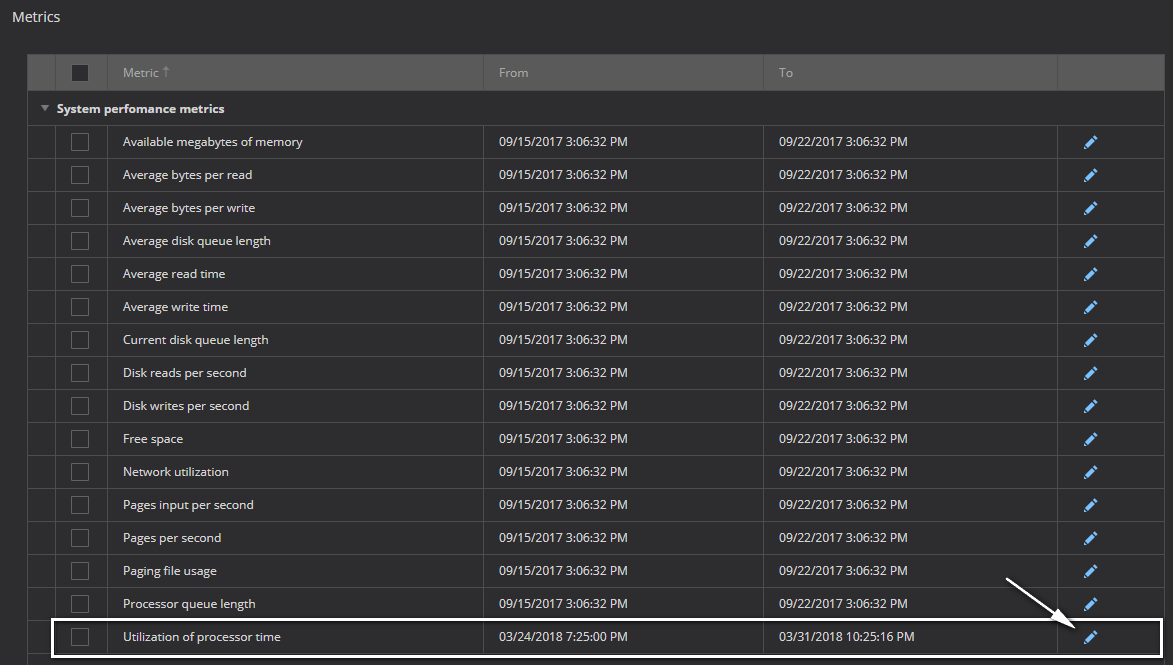
- Locate the metric for which the baseline has to be edited, in this particular case Utilization of processor time %, and click on the pen (edit) button on the right of the metric
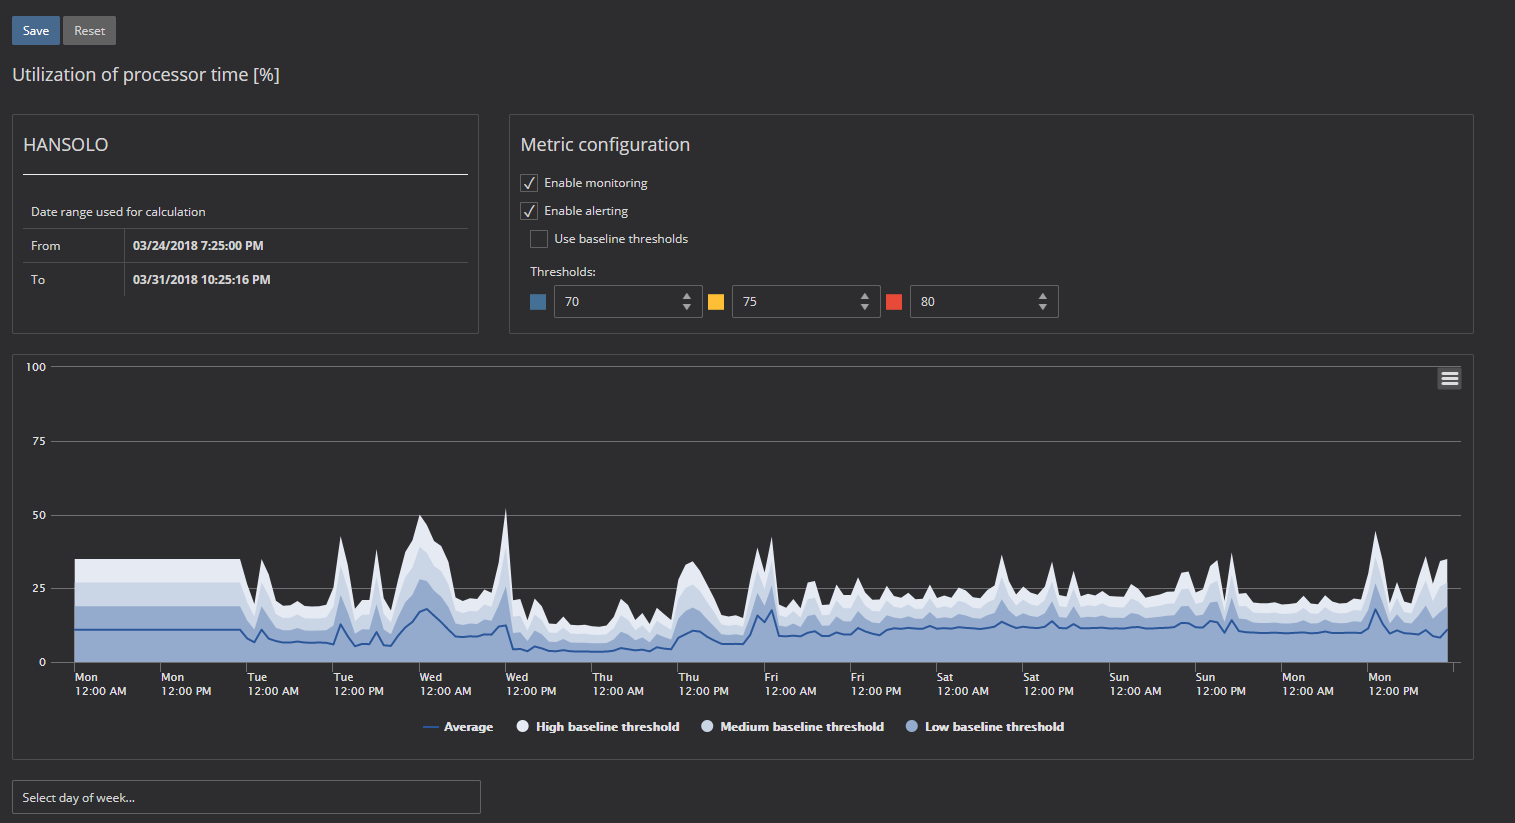
- The baseline configuration page opens
-
The baseline can be selected, directly in the chart, that displays 7 days of the week of baseline data, but in this particular case select a specific day for which the baseline should be edited

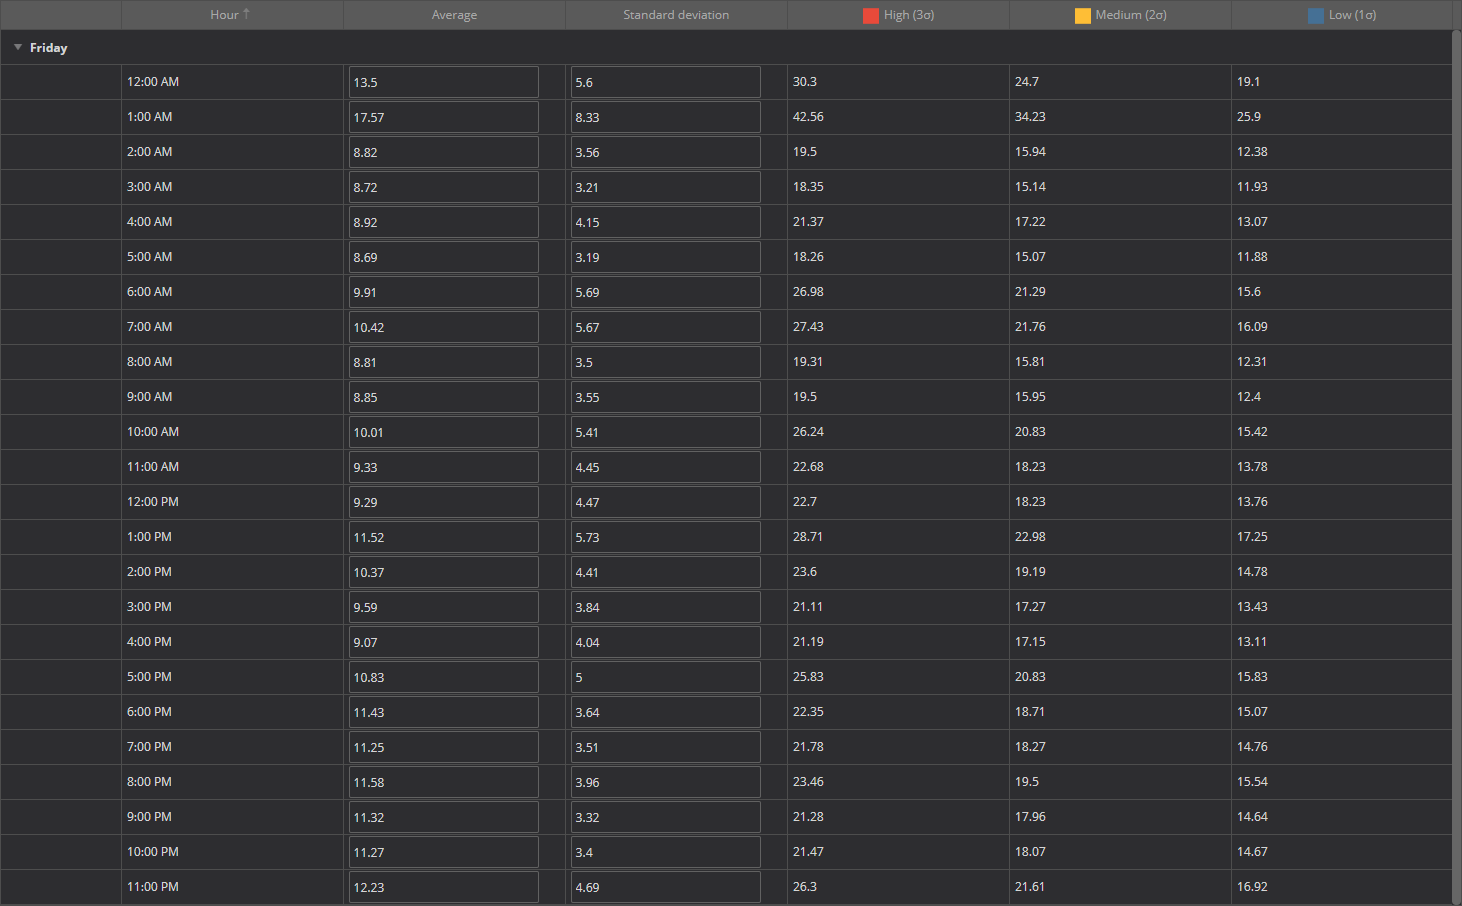
- Now the baseline data for Friday is displayed.
-
The edit page allows changing the baseline directly in the chart by dragging and moving the specific point in the chart

- Alternatively, by editing data directly in the chart, as it is already explained in the KB article
- The final result is like this
- After editing the baseline, press the Save button to store the changes
- The chart, after editing, accommodates the changes and displays the new baseline
As it can be seen, the metric values are now within the normal baseline values and don’t breach the baseline thresholds, therefore no triggering of the false positive alerts
In situations when metrics have a significant discrepancy across the whole range of the calculated baseline, while not affects the SQL Server performance, recalculating the baseline for such metrics to accommodate the new metric values is recommended as a faster way to handle such situation then editing the baselines
Collected metric data are “bad,” and SQL Server performance is continuously affected
It is not unusual that, at the moment when ApexSQL Monitor is installed, SQL Server performance is already affected and, therefore, collected metric data are not entirely suitable for baseline calculation. A situation where such data is used for baselining leads inevitably to a situation where bad performance data values are treated as the normal ones, which as a consequence, results in a situation where alerts are not triggered even when SQL Server performance is severely affected
In the above example, the baseline is calculated while the metric values are quite high, and as it can be seen the high baseline threshold is set in between the 90% and 100%. It is apparent that the metric is continuously above 80% and above the manually defined high threshold which is set to 75%. In such situations, if the baseline is used for alerting, only the very high values like above 90% or 95% can trigger an alert. However, using the baseline, it is easy to determine the level of the success in fixing the performance issue, and at what level, the fix influenced the troubleshooting result
It is important to know that in a situation when SQL Server performance is affected continuously while performance metrics have the high values regularly, it not recommended to use a baseline for alerting. In such cases, manually defined thresholds should be used until the server performance became more or less stable while calculated baseline should be used as a reference that serves as a reference point that shows the level of improvements made during the troubleshooting. Comparing the current data values to calculated baseline can help in understanding at what level various fixes implemented during the troubleshooting helped in resolving the issues
Collected metric data are normal with occasional periods of abnormal metrics
The more usual scenario is that SQL Server occasionally experiences performance issues, so some metrics might have higher data values collected than expected and that have to be used for baseline calculation. In such scenarios, having a baseline could be used quite successfully in one of two ways:
- Using the baseline as is and identify and troubleshoot the specific period where baseline shows significantly higher values of thresholds comparing to the rest of the baseline
- Correct the calculated baseline for the period where the baseline displays significantly higher values of thresholds comparing to the rest of the baseline if it is evident that such behavior is not expected in that time frame. By correcting the baseline to closely resemble the expected behavior, any higher values in the corrected baseline period will trigger the alert, which is the desirable behavior
Useful resources: Establishing a Performance Baseline Creating Simple Performance Baselines with SQL Server Profiler How to detect SQL Server performance issues using baselines – Part 1 – Introduction How to detect SQL Server performance issues using baselines – Part 2 – Collecting metrics and reporting


