
Create an Database Diagram to Use as a Query Template
|
Scenario Your company creates several daily and weekly reports regarding customer sales. You need to create a Database Diagram that can be used as a template for these queries. |
To create a Database Diagram to use as a query template
-
Connect to the Toad Sample (Access) database in the Navigation Manager.
- Select Tools | Diagram.
-
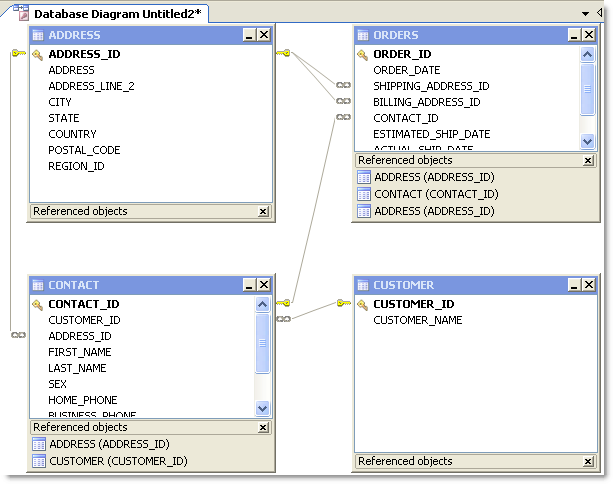
Drag the CONTACT table in the Object Explorer to the Diagram pane.
-
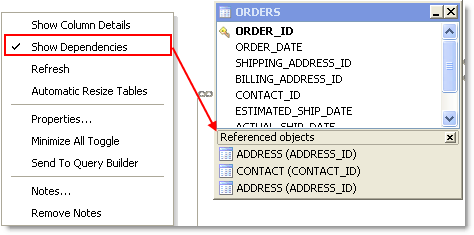
Right click the Diagram pane and clear Show Dependencies to hide the Referenced Objects at the bottom of each table/view, as illustrated in the following screen capture.
- Right-click the ORDERS table and select Notes.
-
Enter the following note in the window for other users:
The shipping and billing ADDRESS_ID foreign key relations are not needed in most queries and should be hidden when building a query.
-
Because it is against company policy to display sex and a home phone number in reports, right click on each of these columns in the CONTACT table and select Hide Column.
Tip: If you have a large number of columns you need to hide, you can right-click a table and select Manage Hidden Columns to quickly select them from a list.
- Click Add to Project from the wizard bar at the bottom of the window and enter DBDiagram_Test asthe name for the file. This adds the file to the current project in the Project Manager under a Diagrams folder.
- Close the Database Diagram window and open the Project Manager window.
- Expand the Diagrams folder and double-click DBDiagram_Test to reload the file in a new Database Diagram window.
- To share your project, hidden columns, and notes with colleagues, complete the following:
- Select Tools | Options | Environment | Network Share, and navigate to a shared drive where you want to store the Project Manager file.
- Select Database | Cache from the open Options window and set the following options:
Object An notation Cache Description Share object annotations Select this checkbox and enter a shared drive location where users can access this file. Share hidden column settings Select this checkbox. - Provide the location of the Network Share and Object Annotation Cache settings to colleagues who need to use this diagram.

Browse Data in Related Tables
Use the Master Detail Browser to browse data in parent tables and drill-down to data in related child tables. This is useful when you need to analyze or edit data. For example, suppose you need to view a list of all Nick's Flix stores and the inventory of comedy movies at each store. Using the Master Detail Browser, you specify the table that contains the list of stores as the parent table and specify the table that contains comedy movies as the child table to quickly locate comedies and analyze the inventory.
To browse tables using the Master Detail Browser
-
Select Tools | Master Detail Browser (ALT+T+A).
-
Drag one or more tables from the Object Explorer, Object Search, or Project Manager window to the Diagram pane at the top of the Master Detail Browser. Press CTRL+click to select multiple tables at once.
Notes:
-
A line between tables indicates any existing relationships between the selected tables.
-
At least one parent table (table without any join arrows pointing to it) must be added to the window or an error message displays when returning results.
-
-
Join Columns.
-
Select the checkbox beside each column you want to include.
Note: Any columns included in a join are automatically included in the results.
-
Click
(F9) to retrieve data for the parent table initially. To view data in a child table, click + to the left of each row.
or
Click
to retrieve data in the parent and child tables. If there is more than one child table, a tab displays for each child table.
-
From the data grid, you can:
-
Edit the data and commit your changes to the database.
-
Right-click the data grid and select Send To | option to add the data to a report, chart, or pivot grid.
-
Tips:
-
Click
to align tables and snap them to the grid.
-
Select the parent table from the drop-down list in the toolbar to view data for a parent table if there are multiple parent tables.
-
Click X on the table you want to remove in the Diagram pane to remove a table and any conditions (e.g., join, where clause) associated with the table.
Query
Tutorial: Build a Query Visually
The Query Builder enables you to create a query without writing or editing SQL statements. Even if you are familiar with SQL, the graphical interface makes it easier to create relationships and visualize the query.
Note: This procedure does not cover all of the possible steps of visually building a query. It only covers the steps required to build a query for the scenario.
|
Scenario Your company wants to improve its global sales, starting with countries where it has a customer base but generally low sales. You need to create a query that identifies countries with less than $500,000 in sales for each of the last four fiscal years. Note: This scenario uses the SH (Sales History) sample schema that comes with Oracle 10g so you can follow the procedure. |
To visually build a query based on this scenario
- Connect to the database and select Tools | Query Builder | Query Builder.
- Select the SH schema in the Object Explorer.
-
Drag the following tables from the Object Explorer to the Diagram pane: TIMES, SALES, CUSTOMERS, and COUNTRIES.
Tips:
- Select Query Builder | Arrange Tables (ALT+Q+A) to have Toad arrange the tables in the Diagram pane.
- You can press CTRL and select a table, and then drag the table into the Editor pane. Click the list to create statements.
- You can also press CTRL and select all of the tables in the Object Explorer, and then drag them into the Diagram pane. Toad automatically arranges the tables.
- Add the following columns to the query by clicking each column:
Table
Column
COUNTRIES COUNTRY_NAME TIMES FISCAL_YEAR SALES AMOUNT_SOLD Tips:
- To view details for a table in the Diagram, click
(F4). If a table is not selected, details for the last selected table display.
- To remove a column from the query, click
or drag column off grid.
- To view details for a table in the Diagram, click
- Complete the following steps to group the data and sum the sales:
- Select the Group By field in the COUNTRY_NAME column, and then click +. The Group By field is in the Criteria pane, which is below the Diagram pane.
- Select the Group By field in the FISCAL_YEAR column, and then click +.
-
Select the Aggregate Function field in the AMOUNT_SOLD column and select Sum. This sums all of the sales per fiscal year per country.
Note: If you select a group by clause or aggregate function for a column, the rest of the columns in the query must also have a group by clause or aggregate function.
- Complete the following steps to select the fiscal year range:
- Select the Where Condition field in the FISCAL_YEAR column and click
. The Where Condition window displays.
- On the Form tab, select BETWEEN in the Operators field.
- Select 1998 in the first Constant field.
-
Select 2001 in the second Constant field and click OK.
Note: The SH schema does not have current data. The 1998-2001 years provide the best data for the purposes of this scenario.
- Select the Where Condition field in the FISCAL_YEAR column and click
- Complete the following steps to select countries with less than $500,000 in sales:
- Select the Having Condition field in the AMOUNT_SOLD column and click
- On the Form tab, select < in the Operators field.
- Select Sum in the Aggregate field.
- Enter 500000 in the Constant field and click OK.
- Select the Having Condition field in the AMOUNT_SOLD column and click
- Select Ascending in the Sort field of the COUNTRY_NAME and FISCAL_YEAR columns.
-
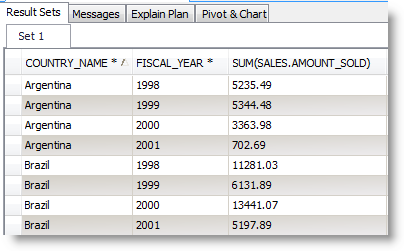
Click
.
The query results display in the Results tab. See View Result Sets for more information.
-
To save the query, right-click the Query Builder tab and select Save File.
You can save a query and any results sets in a Toad editor file (.tef). This file format is useful for building scripts that have large result sets that you do not want to continue executing or for saving results when you have not finished building a script.
- See About Designing Toad Data Reports for more information about creating a report from this data.
See Tutorial: Build a Subquery for a tutorial on creating a subquery.
See Add Subqueries for more information on how to add a subquery.