
BLOB ID Decoder
The BLOB ID Decoder is used to return information about a BLOB. For example, a timer job may say it can't find a BLOB. This tool will help identify where in the SharePoint farm that BLOB is in use.
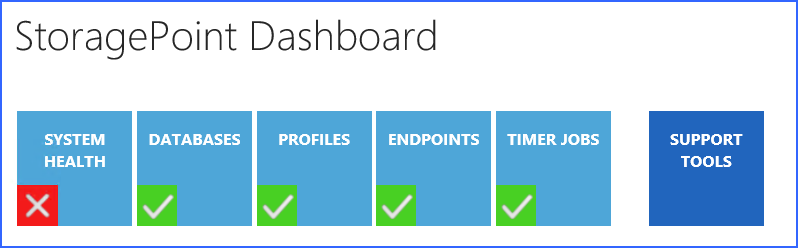
Click Support Tools on the dashboard.
When the window refreshes, paste or type in a BLOB Id and click Parse.
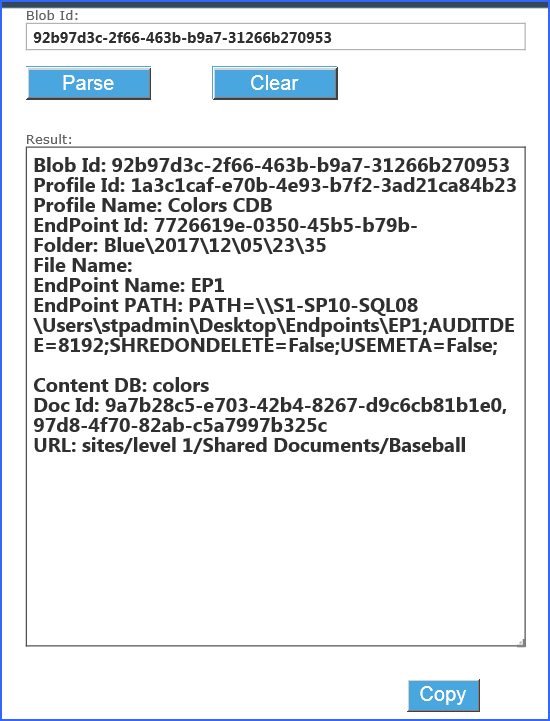
The results will help to identify where the file can be found within the SharePoint farm.
Use the Clear button to clear the search results.
Use the Copy button to copy the search results to the clipboard.
Dashboard Editor
The System Health report can be modified to represent the notification levels that reflect thresholds deemed acceptable.
Go to the General Settings page and click Dashboard Editor.
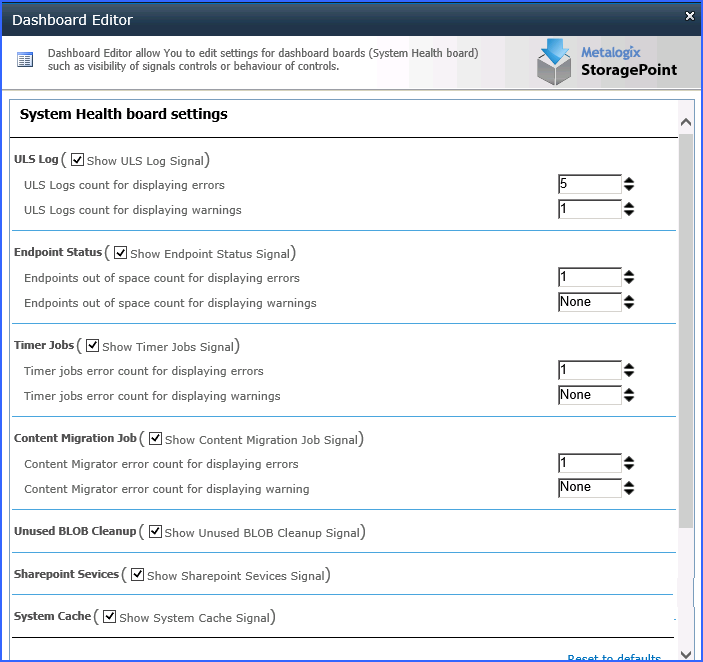
The threshold represents the point at which the notifications become more urgent. For example, if the threshold is 5 for displaying errors, and 1 for displaying a warning, the alert will show as an Error on the ULS information. All errors and warnings can be displayed, but the threshold lets an organization decide at what level it becomes more urgent. If there are between 1 and 4 errors, the alert will show as a Warning.
·Uncheck the boxes to remove a Signal from the System Health dashboard.
·Use the arrows to go up or down by 10, or type a threshold in manually.
Click OK. This will save the Dashboard settings, or click Save on General Settings to exit the General Settings page.
On the dashboard, the selections will be reflected in the amount of data provided.
Example:
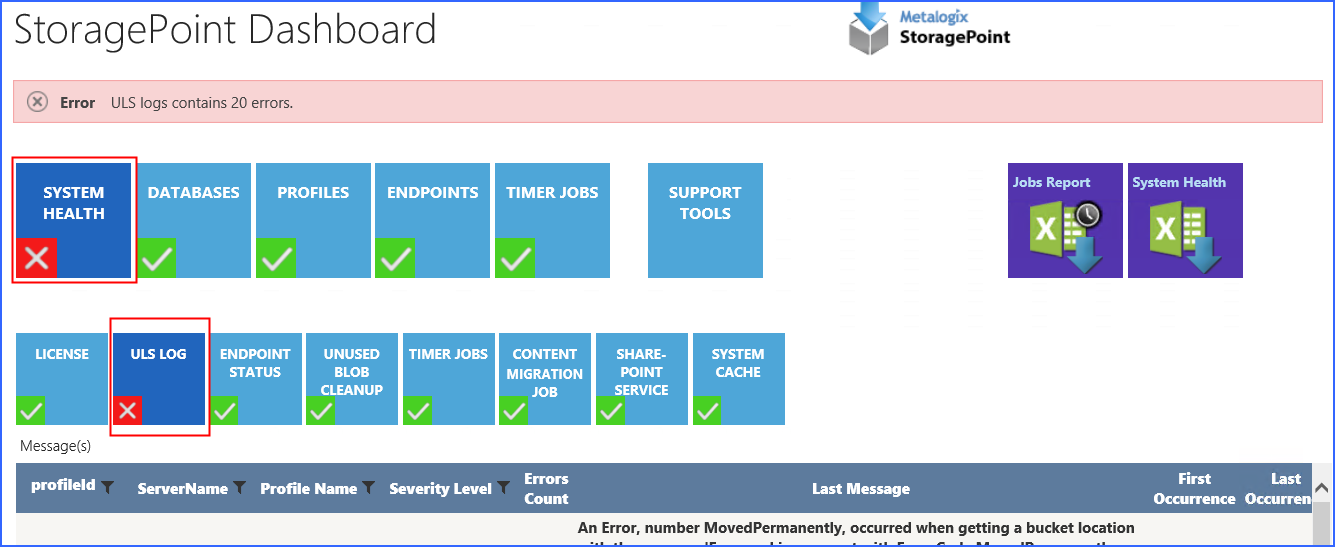
Export Dashboard Data
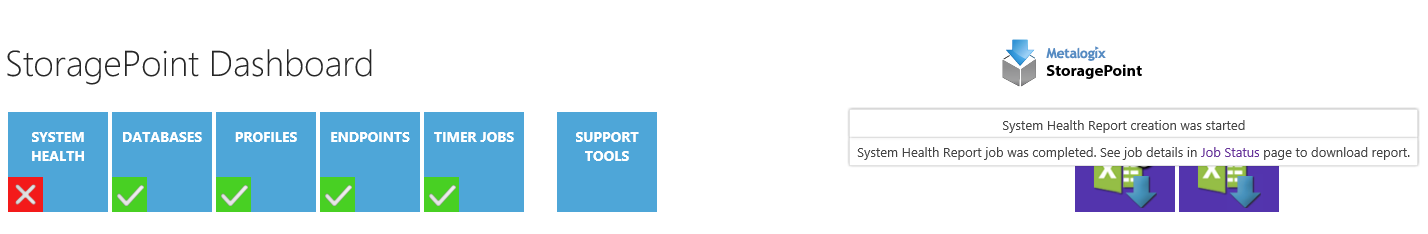
A report of dashboard information can be exported to a CSV file. Click the CSV icon (without the clock) in upper right corner of the screen. Once clicked, a message will display that the job was started, and to go to the Job Status page to retrieve the report (a link is provided in the message). The messages will refresh when the job is complete, and eventually disappear, or can be clicked to remove them from the page.
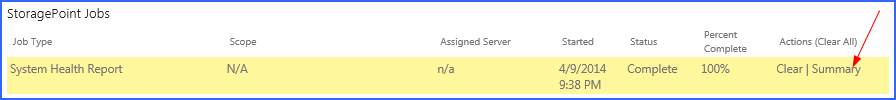
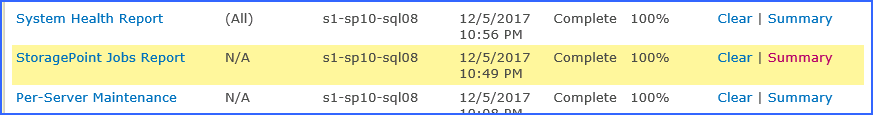
On the Job Status page, click the Summary link for the System Health Report timer job.
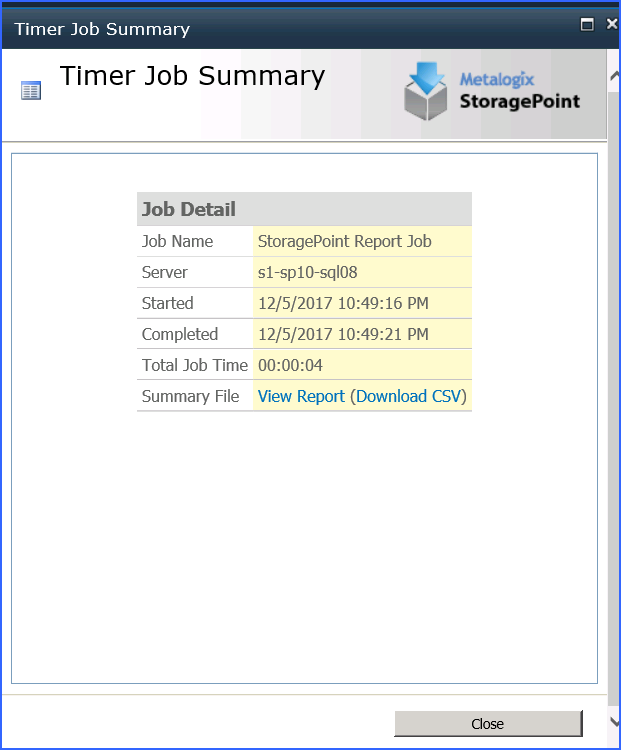
Click View Report to open it in a new window, or click Download CSV to download a copy of the report.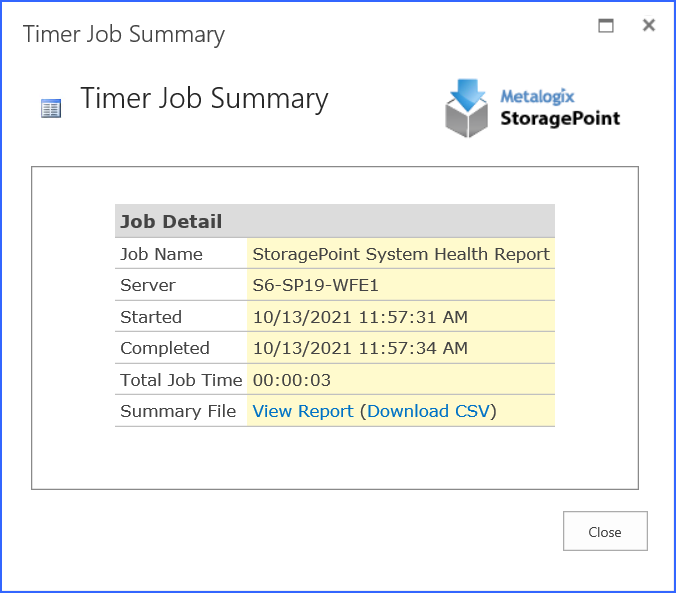
Timer Jobs Report
A report of Timer Job Configurations can be exported to a CSV file. The report shows values for currently running and jobs scheduled to run in the next two weeks. This information should be used to modify timer job schedules to help moderate server load.
Click the CSV icon (with the clock) in upper right corner of the screen. Once clicked, a message will display that the job was started, and to go to the Job Status page to retrieve the report (a link is provided in the message). The messages will refresh when the job is complete, and eventually disappear, or can be clicked to remove them from the page. 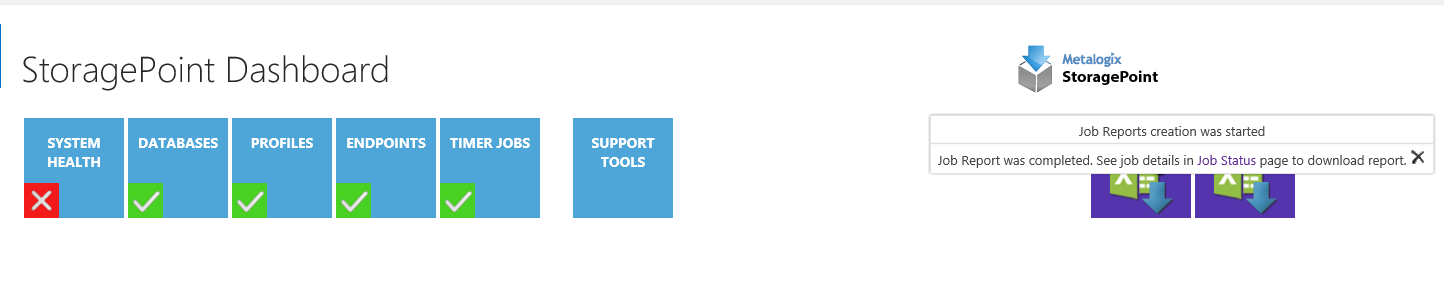
On the Job Status page, click the Summary link for the StoragePoint Jobs Report.
On the Summary page, click the View Report link to view the CSV or click the Download CSV link to save the file. The default file name will be in this format: StoragePoint_Jobs_Report_yyyymmdd_hhmmss.
The data contained in the file will show the most recent information:
·Profile - Name of the profile or NA for Farm Wide Timer Jobs.
·Job Name - Name of the timer job (with Profile ID, where applicable)
·Start - Start time of the most recent run of the timer job. The schedule of the timer job will also be shown, if applicable.
·Server Name - Server where the job was run from.
·Job Duration - The time it took for the job to run.
·Status - This will say Scheduled or Running.
·Explicitly Run, - Yes, If the job was run by clicking a button, rather than by being scheduled.
·Master Job ID - The GUID of a controller timer job, if applicable. Otherwise, N/A.