Setting SharePoint Monitored Page Component Analysis and Web Front End Options
When you add a SharePoint on-premises page to monitor, you can configure the data that Metalogix Diagnostic Manager collects. You can also control which Web front end (WFE) servers the Collection Service uses to collect data. By default, the Collection Service uses the URL you supply to collect data.
|
|
NOTE: If you collect data from select or all WFEs, alternate access mapping, it is no longer required if you are going to monitor pages hosted on a Network Load Balancer, using a Host Header or HostNamed Site Collection. In other scenarios Alternate Access Mapping is still required if you want to use the select or all WFEs options.
REMINDER: For SharePoint Online, public Web pages and Cloud pages, you can only monitor Page Load Times. |

From the Add (or Edit) Page dialog you can choose one or more of the following additional options for monitoring SharePoint on-premises pages:
|
Option |
Description |
|---|---|
|
Page Component Analysis |
When checked, Metalogix Diagnostic Manager checks the server-side render times for each component on the monitored page. Monitoring the render times lets you to examine the impact of each component that makes up the page on the page performance. You can control how often the component analysis is performed. You can perform component analysis every 15 minutes, 60 minutes, or 4 hours (240 minutes). The default is to check every 60 minutes. If the Metalogix Diagnostic Manager solution is not installed on the farm, you cannot collect page component analysis information. NOTE: If the Component Analysis solution is not installed on a farm and you select Page Component Analysis, Metalogix Diagnostic Manager displays critical alerts for the page. The alerts indicate that the solution is not installed. |
|
Collect data using... |
When you monitor a page, you can specify what sources that the Collection Service uses when it retrieves page load time or component analysis information from the SharePoint farm. By default, the Collection Service uses the URL that you specify to collect the page load time data from the farm. You can also collect data from all WFEs or from specific WFEs that you select. |
To set the page component analysis data collection schedule:
1.In the Add Monitored Page dialog box, Page Monitoring Options section, select the Page Component Analysis check box.
2.Select how often you want to collect the data from the Collect individual page component render times every x minutes/hours drop-down list.
To change "Collect" options:
Use the information in the following table to determine the appropriate option(s) to select.
|
If you want to collect data ... |
Then ... |
|---|---|
|
using the exact URL that you specify |
select Collect data using the provided URL NOTE: If no additional data collection (WFE) option is specified, the SharePoint farm assigns a WFE to service the request. Any WFE in the farm can respond. |
|
from all Web Front End servers in the farm |
select Collect from ALL Web Front Ends. |
|
from specific Web Front End servers in the farm |
·select Collect from ONLY the following Web Front Ends AND ·check the box to the left of each Web Front End from which you want to collect data. |
You can also use data collection options in combination. For example, if your environment uses a load balancer, selecting both URL and Web Front End options will allow you to monitor both the load balancer and the Web Front Ends that use it.
Viewing Page Status
Metalogix Diagnostic Manager lets you view the status of the pages that you specify on your SharePoint farm or Server Group. For each page, you can monitor a variety of data points. You can use this information to identify problems in your deployment. Once you have identified the existence of issues, you can then enable component analysis and isolate those components that interfere with optimal performance.
You can monitor pages for availability and load time at all times or only when you suspect a problem. When you discover a problem in a SharePoint farm, you enable Page Component Analysis on the affected page and then review the details for the affected page. When you perform a Page Component Analysis, the Collection Service uses the Metalogix Diagnostic Manager Component Analysis solution to analyze the page on the WFE server. The analysis lets you review the performance of each component that makes up the page and the impact that each component has on the overall load time.
You can also choose to analyze page and component load times and availability on all Web front end (WFE) servers or only on a subset of the WFE servers. Alternatively, you can choose to analyze components and load times on whatever WFE is assigned by the load balancing inherent in your SharePoint farm.
Viewing the Status of All Monitored Pages in a Farm
The Monitored Pages view lets you see the status of all the monitored pages for a single farm or Server Group.
To view the status of all of the monitored pages in a farm:
1In the Management Console tree, double click on the farm or Server Group whose monitored pages you want to view.
2Select the farm's name above the overview pane, and from the drop down panel click Pages.

The Pages view contains the following information:
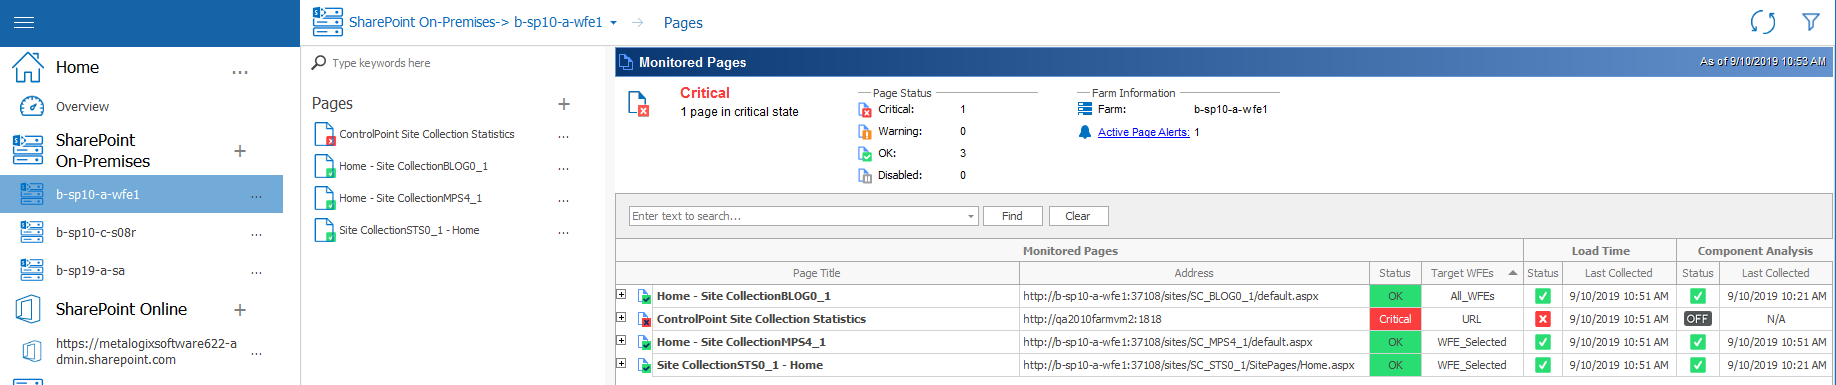
The Top of the Monitored Pages view contains the following information:
·A summary of the monitored pages on the farm or Server Group.
·Information about the farm or Server Group itself, including the number of active alerts.
The Monitored Pages list shows each page being monitored along with the following information:
·Target WFEs (that is, the source the Collection Service uses to collect page data, which is one of the Page Monitoring Options)
·the overall page Status
·the Load Time Status and date/time this information was Last Collected.
·If the Component Analysis solution has been deployed, the Component Analysis Status and date/time this information was Last Collected.
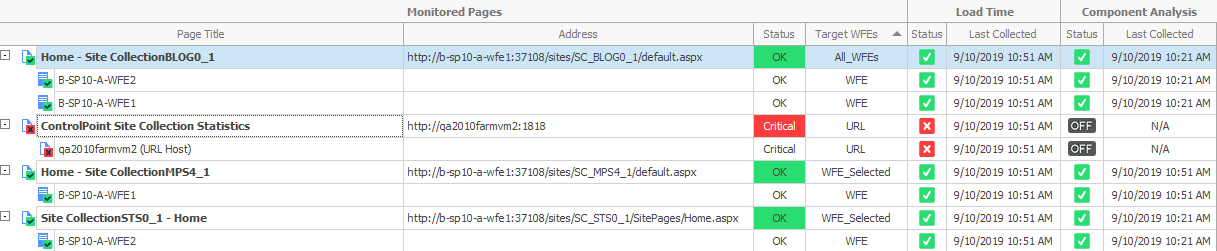
Expand a page to display the source(s) used for page data collection.
|
|
NOTE: If you want to expand all pages in the list, right-click in the grid and choose Expand All. |
You can also use the search box to locate all instances of a text string within the list.
From the Monitored Pages ribbon, you can choose to:
·Filter results by selecting/deselecting check boxes
·View either All Pages or By Status.
·Add a page.
·Remove a page
·Edit the settings for a monitored page
·Disable a page.
·Enable a disabled page.
·Edit the page alert thresholds
·View the active alerts for the monitored pages
·Collect page load metrics immediately
·Refresh the monitored page list
·View details of a single monitored page
Viewing the Status of a Single Monitored Page
The Page Status view provides an in-depth view of the status of a single monitored page. You can also review configuration and page performance information using this view.
If data collection is disabled for a page, Metalogix Diagnostic Manager displays only the Summary tab.
|
|
NOTE: that the information may be out of date as the data on the tab is current as of the time of the last data collection. |
To view the status for a single monitored page:
1In the Management Console tree, double click on the farm or Server Group whose monitored pages you want to view.
2Select the farm's name above the overview pane, and from the drop down panel click Pages.
3Double click the page whose status you would like to view/monitor.
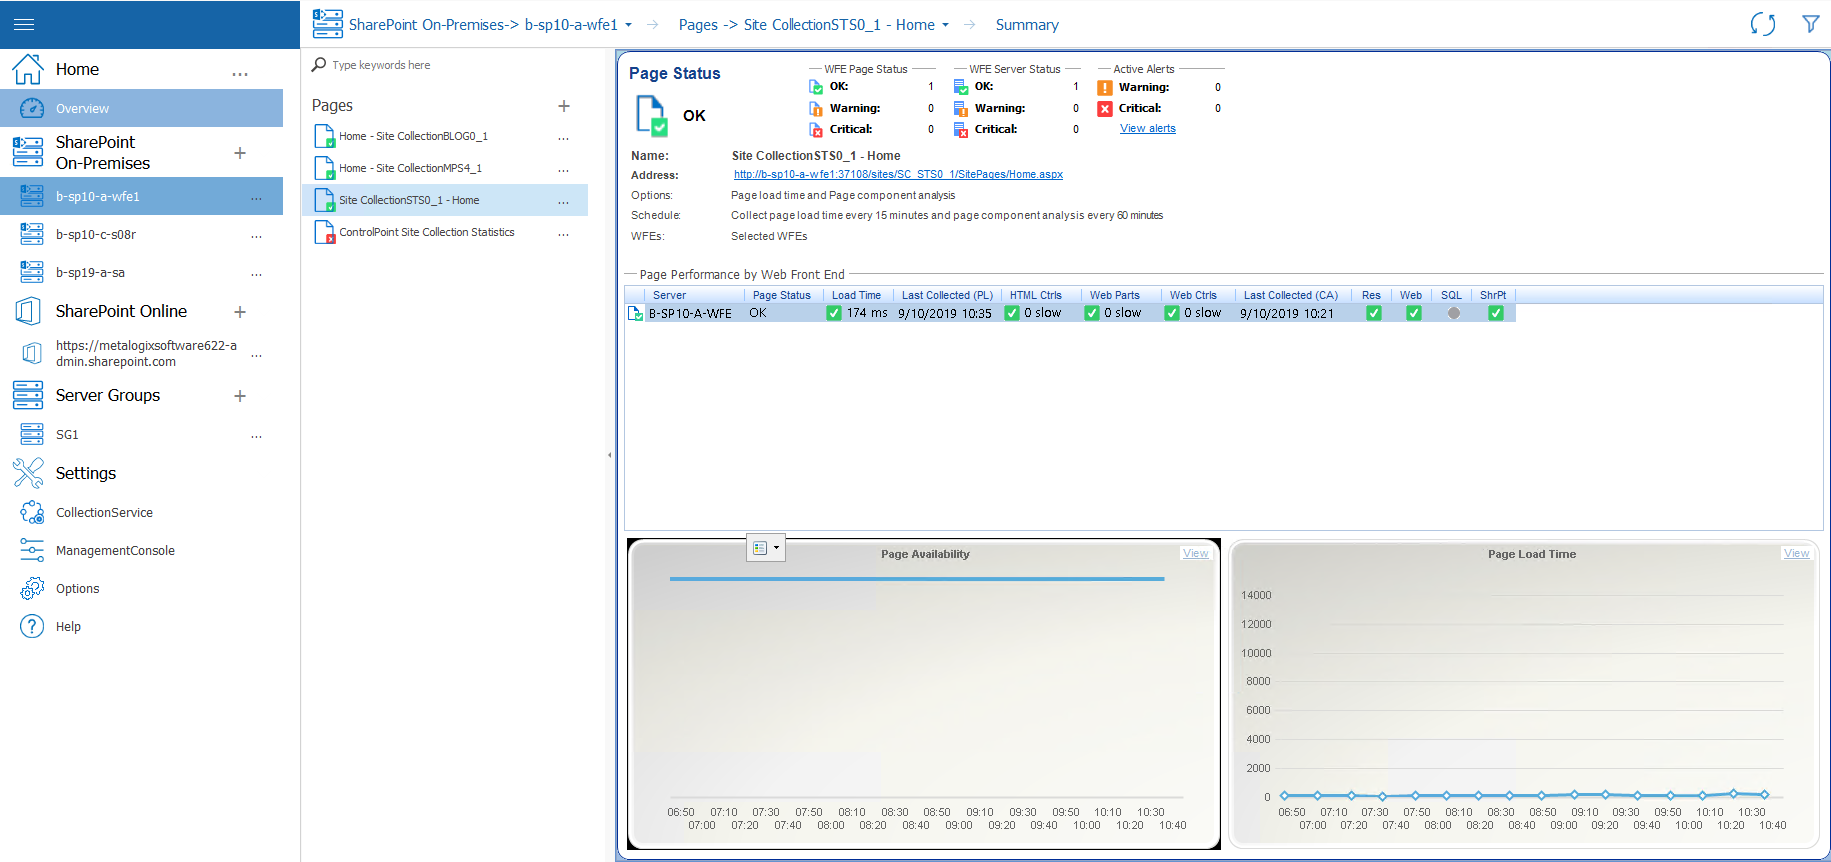
The following information is available in the Page Status view:
·The status of the page on each monitored Web front end (WFE) Server. If the page is a URL-only page, the server is listed as a URL Host.
·The number of currently-Active Alerts for the page, categorized by type.
·The Page Name that was assigned when the page was added.
·The Page Address (URL) in the SharePoint farm.
·The Schedule used by the Collection Service to retrieve the page information.
·Which Web Front Ends (WFEs) the page information is collected from.
Note that status information captured depends on the server role. For example, a load balancer will not have data for Web, SQL, or SharePoint
To view page details by Web front end:
In the Page Status Summary view, double-click a Web front end server.
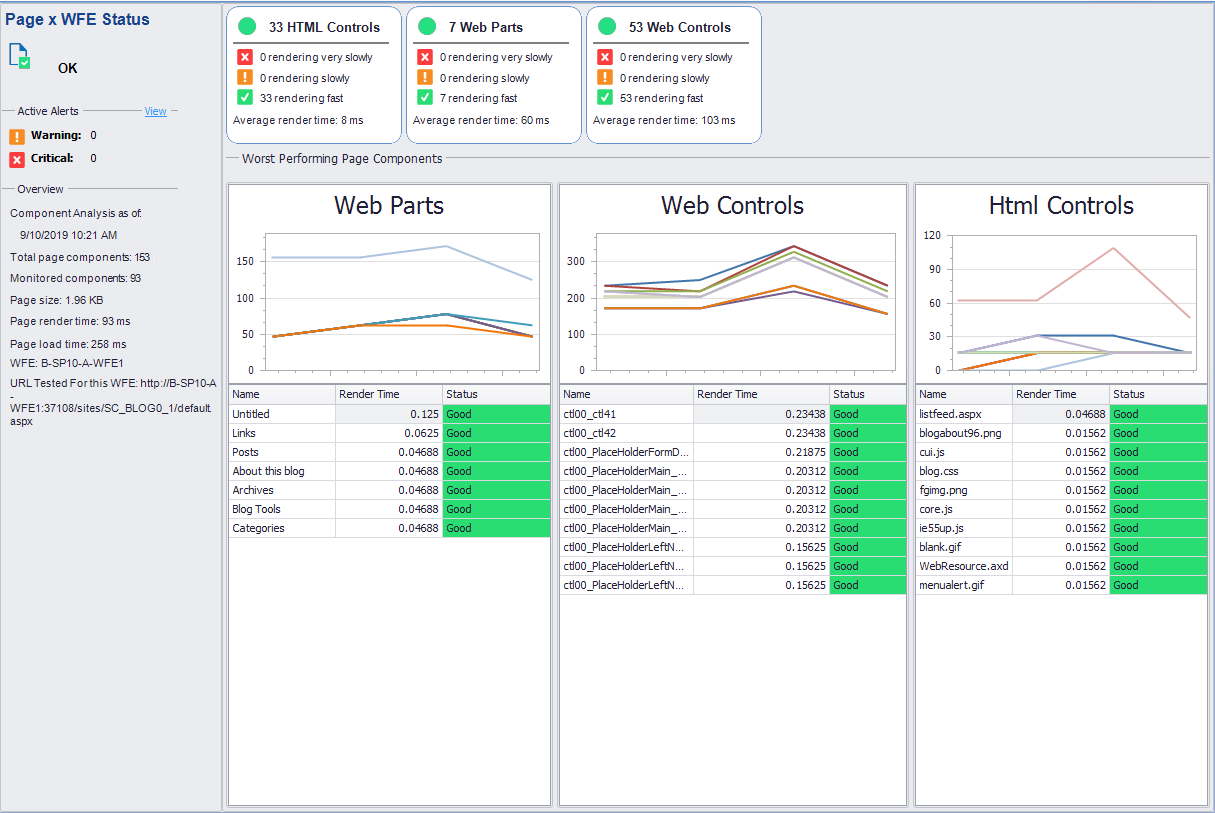
The Page Details by Web Front End tab includes information about the page as loaded from a particular WFE server.
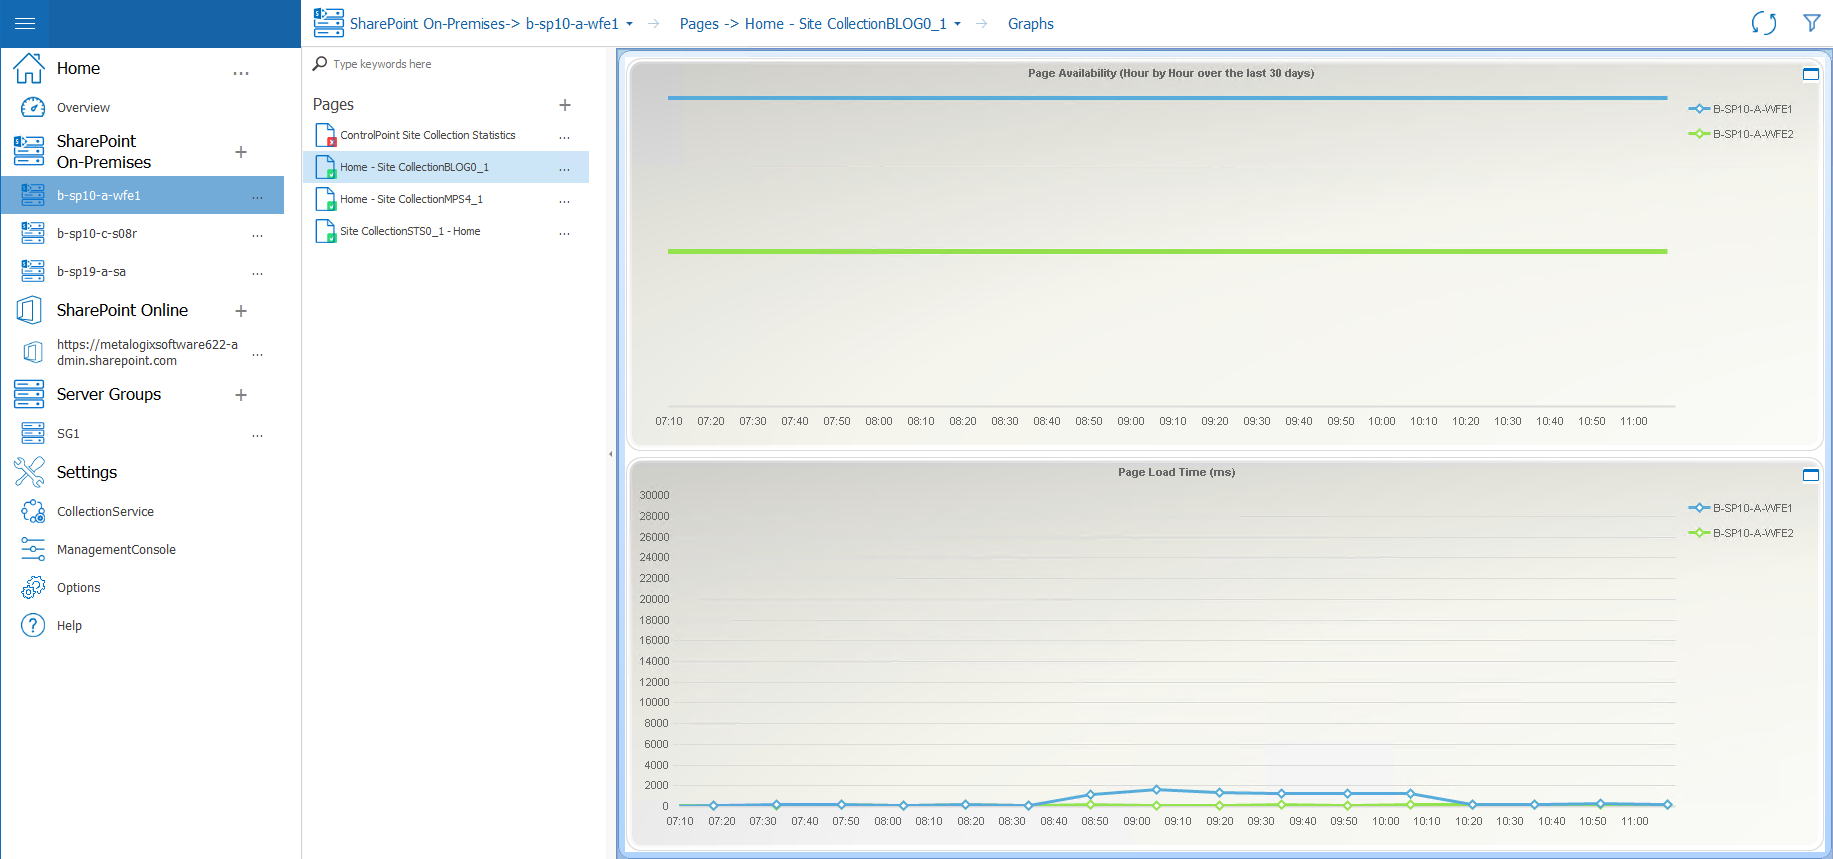
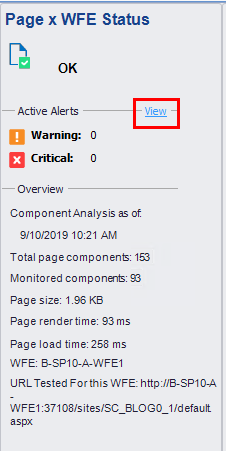
To view more details about graphs:
In the Page Status view, either:
·Click the View hyperlink within an available graph.
OR
·Select the Graphs tab, avialable when you select the Monitored Page name above the overview, which then produces a drop down panel.
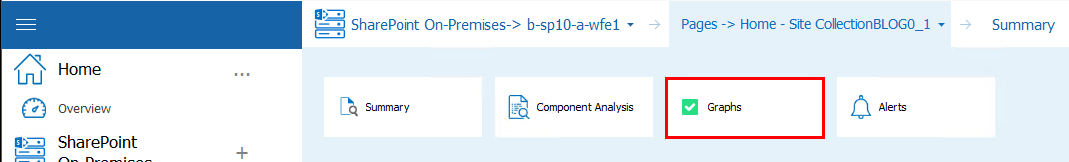
The Graphs tab includes detailed versions of the graphs on the Summary tab.