Viewing Component Analysis Information for a Single Monitored Page
If the Component Analysis solution is installed and deployed for an on-premises SharePoint farm, you can review component loading on a monitored page.
|
|
NOTE: If Component Analysis is not enabled for a page, the Page Details view includes only the information that is available in the Summary view. |

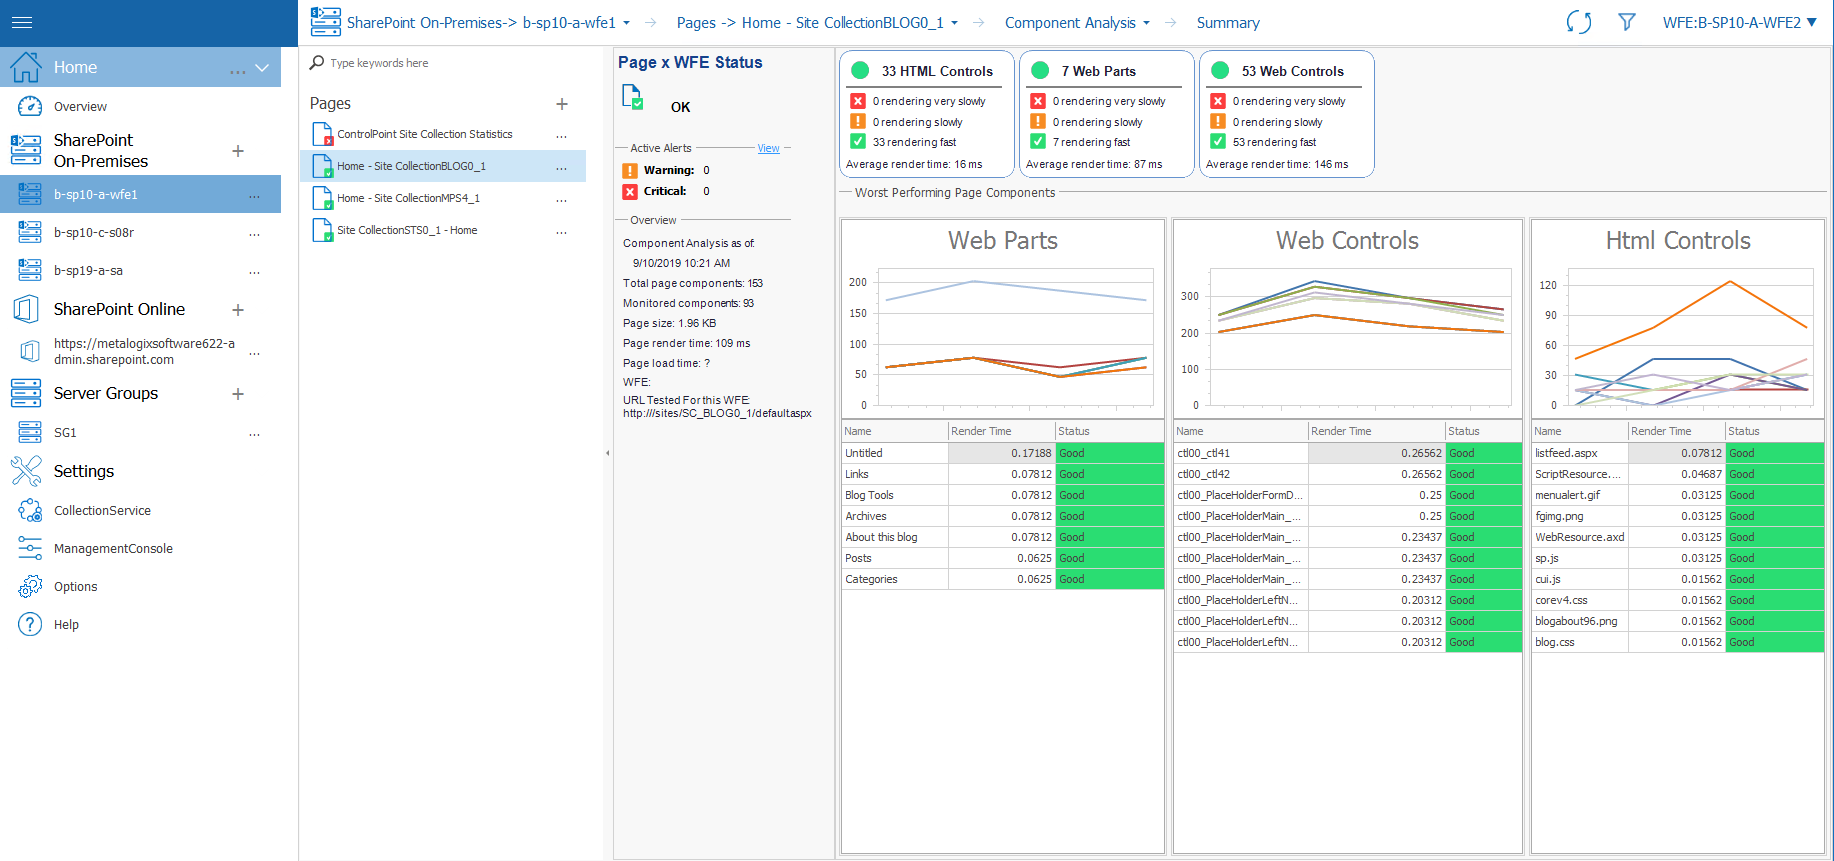
The Component Analysis view lets you:
·The Web front End (WFE) that the data was collected from.
·The number of Active Alerts for the page, arranged by category.
·A Page Overview, including the time the analysis took place, the components, the page size, the page render time the page load time, the WFE name, and the URL the Collection Service used to retrieve the data.
·Information about the HTML Controls on the page, including the overall status of the HTML controls.
·Information about the solutions on the page, including the overall status of the Solutions.
·Information about the Web Controls on the page, including the overall status of the Web Controls.
·A list of the Worst Performing Page Components; that is, components that take the longest to render on the WFE. You can use this list to optimize the page load time.
·A graph of the Page Availability on the WFE. If the Page Load Time option is selected for this page, this graph appears.
·A graph of the Page Load Time on the WFE, measured in milliseconds (ms). If the Page Load Time option is selected for this page, this graph appears.
|
|
NOTE: status information captured depends on the server role. For example, a load balancer will not have data for Web, SQL, or SharePoint |
To view a Component Analysis Summary for a single monitored page:
1In the Management Console tree, double click on the farm or Server Group whose monitored pages you want to view.
2Select the farm's name above the overview pane, and from the drop down panel click Pages.

3Double click the page you would like to see the component analysis for.
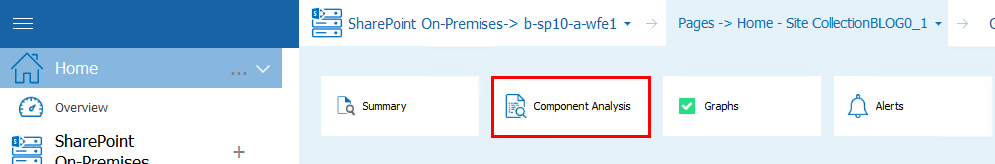
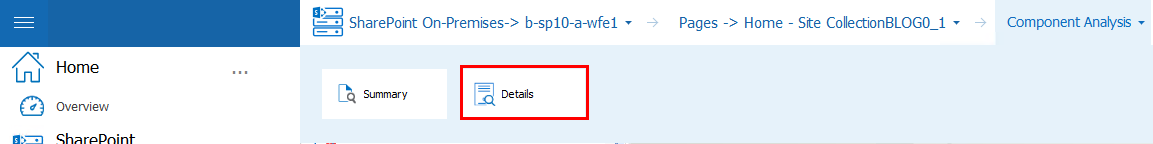
4Select the page's name, above the overview panel for that page. This will produce a drop down panel, click Component Analysis.
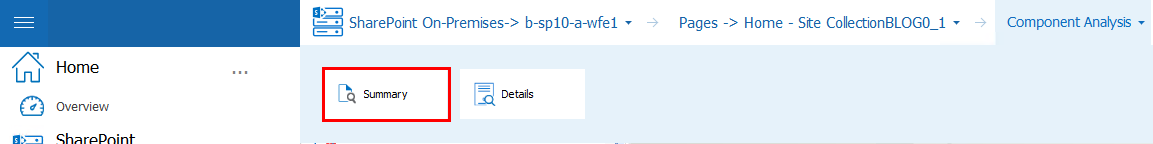
5Select Summary from the next drop down panel.
6This will open a summary of the component analysis for that page.
To view Component Analysis detail:
Select Component Analysis next to the Page's name above the overview, this will produce the drop down menu from step 5 above, select Details.
Page Component Details include:
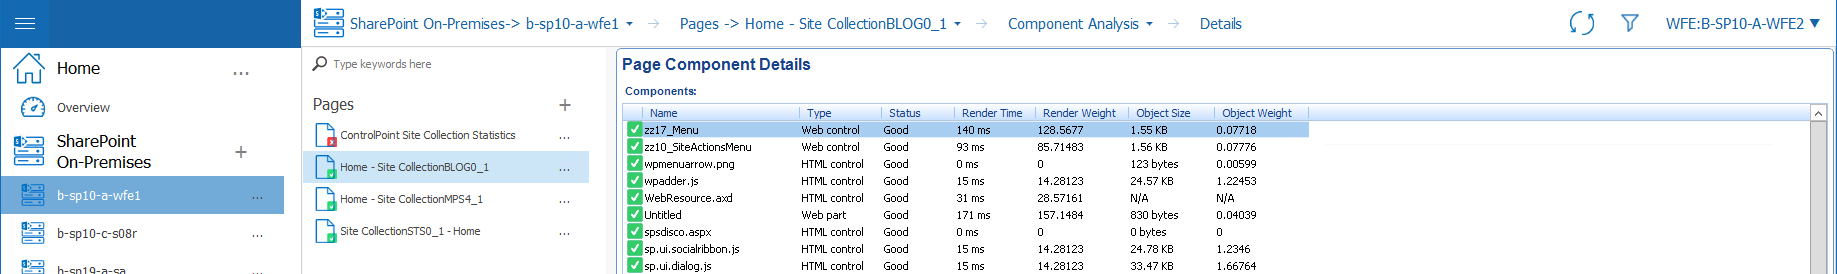
·The Name of the page component.
·The Type of component.
·The Status of the component.
·The Render Time; or time required for the Internet Information Server (IIS) on the WFE to render the component, measured in milliseconds.
·The Render Weight, or relative importance of the component in relation to the whole page.
·The Object Size of the component, measured in bytes.
·The Object Weight, or amount of weight the Management Console assigns to the component when assigning the alert status.
|
|
NOTE: The Page Status area lists the Total Components and Monitored Components for the page. For many pages, these values do not match. This is because Metalogix Diagnostic Manager does not monitor components that do not have a bearing on the overall performance of the page in favor of a focus on components that do impact the page performance. For example, simple text components are omitted from the monitored components. |
To Switch to the Component Analysis for a different WFE:
Select a different WFE from the WFE drop down in the top right hand corner.

Collecting a Page Component Analysis Immediately
Metalogix Diagnostic Manager refreshes the Component Analysis for a monitored page on a schedule you specify which, by default, is every 60 minutes. (See Setting Monitored Page Options and Web Front Ends.) You can, however, immediately collect page component information for:
·all monitored pages in the selected farm
OR
·a single monitored page.
|
|
NOTE: For this information to be collected, the Page Component Analysis option must be enabled for the page. See also Editing Monitored Page Settings. |
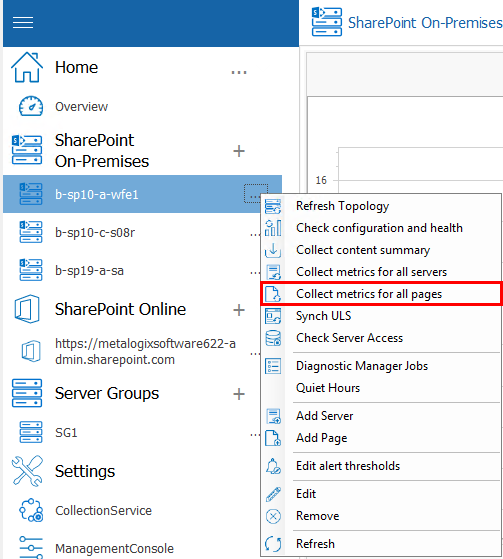
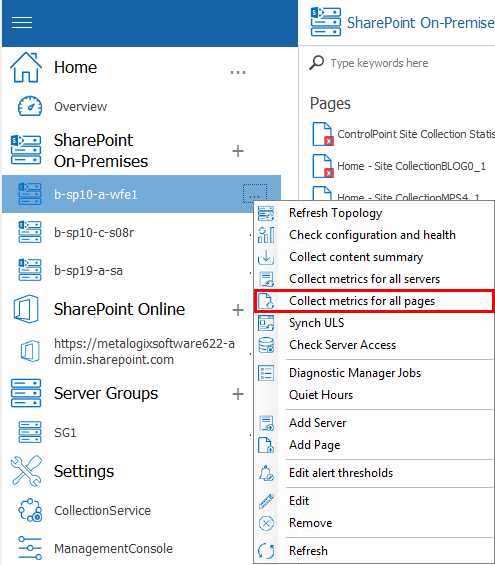
To collect component analysis data for all monitored pages:
1In the Management Console, select the (...) next to the farm or server for which you want to collect component data. Select Collect Metrics for all Pages.
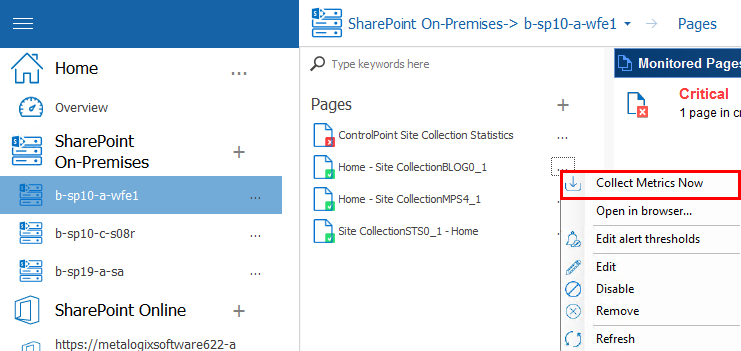
To collect component analysis data for a single monitored page:
1In the Management Console tree, double click on the farm or Server Group whose monitored pages you want to view.
2Select the farm's name above the overview pane, and from the drop down panel click Pages.
3Do one of the following:
Select the page for which you want to collect data, right-click and choose Collect data for selected pages.
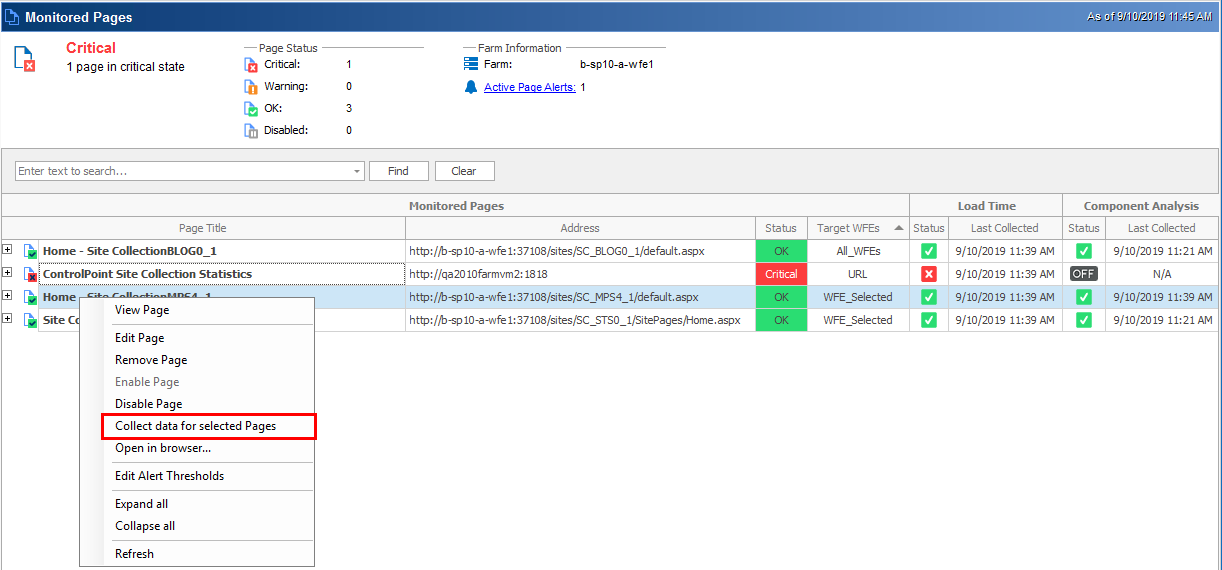
or
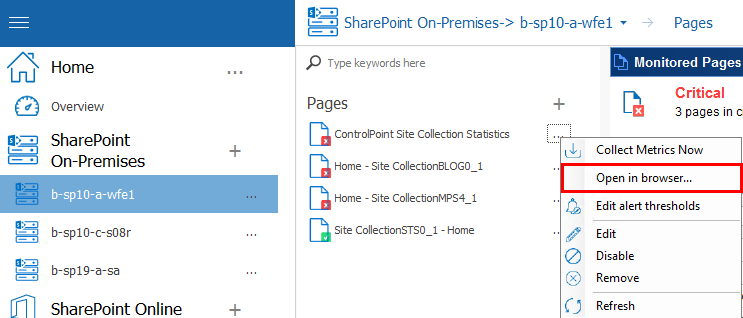
Select the (...) next to the page name, and select Collect Metrics Now from the drop down menu.
Collecting Page Load Metrics Immediately
Metalogix Diagnostic Manager lets you immediately collect page load metrics for all of the monitored pages in a single farm for which the Page Load Time option has been checked. (See also Editing Monitored Page Settings.)
When you collect Page Load metrics, the Collection Service collects the metrics for all monitored pages in the farm, not for a single page.
To collect page load metrics immediately:
In the Management Console, select the (...) next to the farm whose page load metrics you want to collect, and select Collect metrics for all pages.
Opening a Monitored Page
From the Management Console tree, you can open a monitored page in a browser.
To open a monitored page:
1In the Management Console, select the farm that contains the monitored page you want to open.
2Select the farm name above the overview pane, and select Pages from the drop down panel.

3In the pages column, select the (...) next to the page you want to view, and click Open in Browser from the dropdown menu.