Administering and Configuring Foglight
Foglight comes with the following additional built-in roles which control access to the dashboards in Foglight. This Administration and Configuration Guide provides conceptual information about Foglight® administration, and instructions for using the administration dashboards. It contains an overview of the administration features and their location in the browser interface.
This guide is intended for Foglight system administrators who need to administer and configure Foglight.
For more information about specific administration tasks, or additional technical information that further describes Foglight administration features, see the Administration and Configuration Help.
Configuring Foglight for initial use
Foglight® collects data from monitored hosts and builds models with tree-like structures in real time. Foglight administration capabilities allow you to configure the hosts for monitoring, dictate how the data is collected, restrict user access, and build and edit flexible rules to implement your business logic. The type and range of administration steps depends on the complexity of your monitoring needs.
The Foglight browser interface includes a set of dashboards that have administration capabilities. To access them, your user account must belong to a group with the Administration role. Administrators can manipulate agents, rules, derived metrics, registry variables, cartridges, types, and scripts.
In most environments, one of the first things you are prompted to do after installing Foglight and logging in to the browser interface is to install a valid license. Next, you configure email actions, to ensure that Foglight can send email to interested parties when pre-defined thresholds are reached. If you also manage user access, you can create user accounts and assign the appropriate permissions.
Logging in to Foglight
The Foglight® user interface runs inside a web browser. Before you log in, ensure that your Foglight Management Server is up and running, and obtain your user name and password. The default account, foglight/foglight, provides full access to the browser interface.
You can access the browser interface by opening a web browser instance and navigating to the Management Server URL, which uses the following syntax: http://<localhost>:<port>, where localhost and port are the name of the computer and port number on which the Management Server is running. The security settings associated with your user account determine which dashboards you can access.
The first page you see also depends on the edition of Foglight that you are running:
The first time that you log in to Foglight, the Welcome page appears in the display area.
The appearance of the Welcome page depends on your user permissions. If your user account belongs to a group that has the Administrator role, you see the Welcome page with a list of the common administration tasks that you typically perform upon logging in to Foglight.
To access the full Administration dashboard, in the navigation panel, under Homes, click Administration.
The first time that you log in to Foglight Evolve, the Getting Started tab of the Environment Overview page appears in the display area.
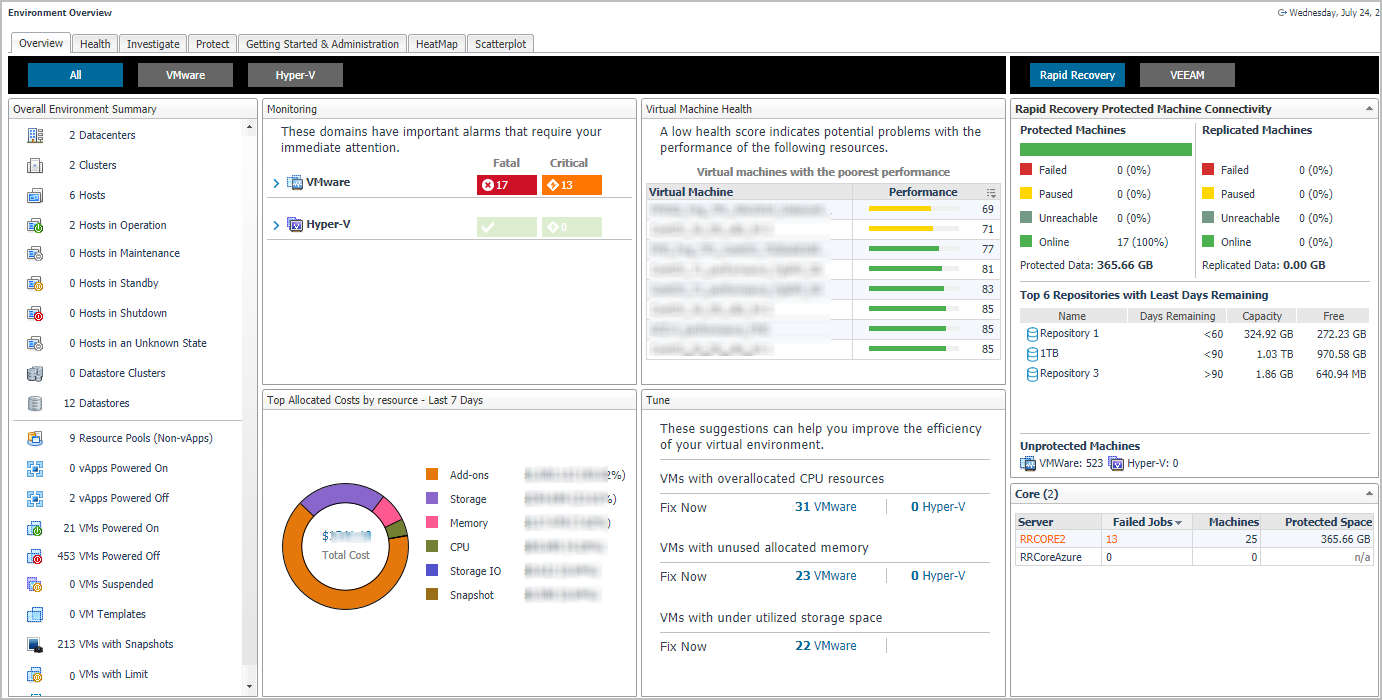
To access the Environment Overview dashboard, in the navigation panel, under Homes, click Environment Overview.
|
|
|
|
Overview |
|
• |
Monitoring. Highlights the alarms that need immediate attention, for each monitored domain. Drill down into the available links, to review the alarms in more detail. |
|
• |
Virtual Machine Health. Provides a list of virtual machine with the lowest health score in your environment. To investigate the potential problems affecting the health of a resource, click the virtual machine name or the performance icon. |
|
• |
Tune. Provides a list of suggestions for making your virtual environment more efficient. Clicking the Fix Now link opens the Optimizer Main View dashboard, which allows you to optimize your environment, as necessary. |
|
• |
Rapid Recovery/VEEAM. Provides an overview about the protected and unprotected virtual machines in the monitored environment. | |
|
Health |
|
• |
VMware. Highlights the alarms that need immediate attention, in your VMware® environment. Drill down into the available links, to review the alarms in more detail. |
|
• |
Hyper-V. Highlights the alarms that need immediate attention, in your Hyper-V® environment. Drill down into the available links, to review the alarms in more detail. |
|
• |
Storage. Highlights the alarms that need immediate attention, in your Storage Management environment. Drill down into the available links, to review the alarms in more detail. | |
|
Investigate |
|
• |
Resource Efficiency. Provides a list of suggestions for making your virtual environment more efficient, for each type of virtual object. Clicking the Optimize or View more details links opens the Optimizer Main View dashboard, which allows you to optimize your environment, as necessary. |
|
• |
Highest Impact Changes (VMware only). Displays the change events of objects and the performance impact to the change objects. |
|
• |
VMs with CPU Problems. Provides a list of virtual machines experiencing CPU problems. Clicking a virtual object to drill down and investigate the issues in more details. |
|
• |
VMs with Memory Problems. Provides a list of virtual machines experiencing memory problems. Clicking a virtual object to drill down and investigate the issues in more details. |
|
• |
VMs with Storage Problems. Provides a list of virtual machines experiencing storage problems. Clicking a virtual object to drill down and investigate the issues in more details. |
|
• |
VMs with Network Problems. Provides a list of virtual machines experiencing network problems. Clicking a virtual object to drill down and investigate the issues in more details. | |
|
Protect |
|
• |
Core: This table lists the monitored Rapid Recovery Core Servers. Click this link to navigate to the Rapid Recovery Infrastructure Tab. |
|
• |
Machine Connectivity: This table shows the connectivity state of machines protected and replicated on the monitored Rapid Recovery core. It also shows connectivity for data on recovery points-only machine. |
|
• |
Trouble Monitor: This table shows job activity, connections with the license portal, and transfer activity to detect early on the monitored Rapid Recovery core. The time range is configurable, defaulting to last 24 hours. Click this graph to navigate to the Events > Journal tab. |
|
• |
Top 8 Repositories with Least Days Remaining: This tables shows the top eight repositories with the least days remaining on the monitored Rapid Recovery core. Click this link to navigate to the Repositories Capacity Planning Tab - Rapid Recovery. |
|
• |
Transfer Job per Machine: This table shows, by protected machine of which the latest transfer job is failed, the number of successful and failed transfer jobs in the specified time range. This table shows the top ten machines with the most failed transfer job. The time range is configurable, defaulting to last 24 hours. Click this graph to navigate to the Events > Tasks tab. |
|
• |
Transfer Jobs: This table shows all snapshot data transfers (including base images and incremental snapshots) that completed in the specified time range. The time range is configurable, defaulting to last 24 hours. Click this graph to navigate to Events > Tasks tab. |
|
• |
Backup Servers: This table lists the monitored Veeam Backup Core Servers. Click this link to navigate to the Veeam Infrastructure Tab. |
|
• |
Protected VMs Overview: This table presents the information about how your VMs are protected, number of protected VMs (backed up or replicated), number of restore points available, source VM size, full and incremental backup size, and successful backup sessions ratio on the monitored Veeam Backup Server. |
|
• |
Backup Window: This table shows the total duration of Backup and Replication jobs. |
|
• |
Top 8 Repositories with Least Free: This tables shows the top eight repositories with the least days remaining on the monitored Veeam Backup server. Click this link to navigate to the Repositories Capacity Planning Tab - Veeam. |
|
• |
Transfer Job per Machine: This table shows, by protected machine of which the latest transfer job is failed, the number of successful and failed transfer jobs in the specified time range. This table shows the top ten machines with the most failed transfer job. The time range is configurable, defaulting to last 24 hours. Click this graph to navigate to the Jobs tab. |
|
• |
Transfer Jobs: This table shows all snapshot data transfers (including base images and incremental snapshots) that completed in the specified time range. The time range is configurable, defaulting to last 24 hours. Click this graph to navigate to Jobs tab. | |
|
Getting Started & Administration |
|
• |
Monitor SAN Storage. Allows you to monitor the SAN Storage, provided that the Storage Management license trial has been activated. |
|
• |
Start monitoring storage devices. Launches a wizard to start creating Storage Management agents. For more information, see the Foglight for Storage Management User and Reference Guide. |
|
• |
License Management. All Foglight components are license-protected. Some components are covered by the base Foglight license, while others require an additional license. Foglight restricts access to only those features enabled by active license files. In a typical installation, you need a license for the Management Server, along with a license for each license-protected component that exists in your monitoring environment. License-protected components may be installed on the server prior to installing the corresponding license, however such components will be disabled until a valid license is installed. |
|
• |
Add a new license. Allows you to quickly access the Manage Licenses dashboard. For more information on licenses, see the Administration and Configuration Guide. |
|
|
HeatMap |
Shows a Heat Map of the virtual machines monitored in the VMware or Hyper-V environment. |
|
Scatterplot |
Shows a Scatterplot of the virtual machines monitored in the VMware or Hyper-V environment. |
For more information, see the following topics:
Managing Licenses
Foglight® includes a licensing capability that restricts access to only those features that are defined in the license file. A server installation requires a license file that provides access to the server-specific part of the browser interface and the features associated with it.
All Foglight cartridges are license-protected. The base Foglight license covers some cartridges, while others may require an extra license. The cartridges included with the server do not require any additional license. The Foglight Agent Manager and Infrastructure cartridges fall into this category. Some cartridges installed on the server require an extra license.
In a typical installation, you need a license for the Management Server, along with a license for each license-protected cartridge that exists in your monitoring environment. If a cartridge requires a license, install the license on the server immediately after installing or upgrading that cartridge. Foglight allows you to install a license-protected cartridge on the server before installing its license, however it disables the cartridge until a valid cartridge license is installed.
Foglight can limit the number of monitored instances of certain object types according to the restrictions in the associated licenses. When that limit is reached, the server stops creating instances of that type and triggers an alarm with a message indicating the problem. For example:
You can install and manage Foglight licenses using the Manage Licenses dashboard. To access this dashboard, from the Administration dashboard, in the Setup column, click Manage Licenses.
