Tchater maintenant avec le support
Tchattez avec un ingénieur du support

Foglight for Oracle (Cartridge) 6.3.0 - User Guide

Installing and Configuring Agents Using Foglight for Oracle
Viewing the Databases Dashboard Assigning Instances to Users Selecting an Instance to Monitor Foglight for Oracle Overview Dashboard Overview view Advisories view SQL Performance Investigator (SQL PI) Oracle Activity Drilldown Pluggable Databases Drilldown Storage Drilldown Reviewing Configuration Settings Reviewing the Alert Log Reviewing Monitored Data Guard Environments Reviewing ASM Instances Reviewing Exadata-related Information
Administering Foglight for Oracle Reporting Reference Glossary

Reviewing the Alert Log

By default, the Alert Log panel displays all of the alert log messages.

To display messages under a pre-defined name, category and severity, create or edit patterns for these messages in the Match List, which is found in the Alert Log view in the Databases Administration dashboard, and add the corresponding regular expressions to this list. To prevent messages from being displayed on the Alert Log panel, add these messages to the Ignore List.

The Alert Log panel comprises the panes described in the following topics:

The Alert Log Messages chart provides a graphic, color-coded representation of the various alert log messages, broken down by their severity level, as described below.

The severity assigned for each alert, as well as the minimal severity level (Warning or higher) for which alarms are to be invoked as a result of the alert, are defined using the Alert Log view in the Databases Administration dashboard, accessible from the Agent Settings button.

The Alert Log Messages table provides the following details about each alert log:

Reviewing Monitored Data Guard Environments

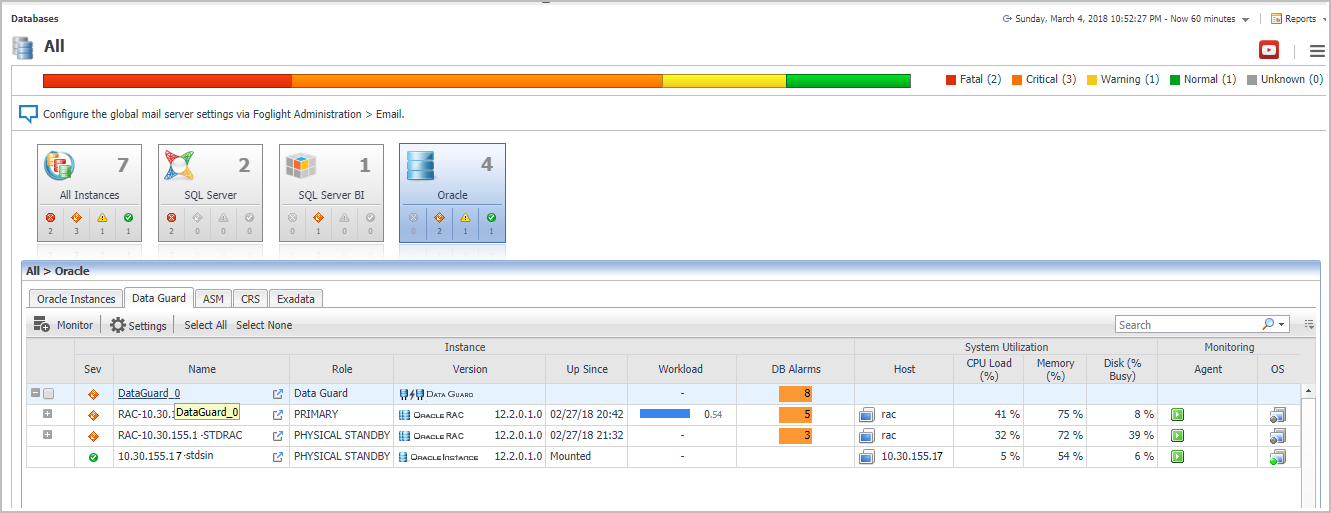
Starting in version 5.7.5.50, Foglight for Oracle provides a detailed dashboard for monitoring Data Guard environments. The Data Guard environment information is presented only after Data Guard environments are configured. The Data Guard tab lists all Data Guard environments which have been configured.

To access the detailed dashboard for that Data Guard environment, click the name of that Data Guard environment under the Name column.

The Data Guard dashboard displays a Data Guard status, provides information about Primary and Standby databases, monitors progress and performance of log transfer and apply processes.

The Data Guard dashboard has three tabs:

Reviewing Summary Information

The Summary tab displays information about all Primary and Standby databases that are configured for the Data Guard environment. It comprises the following sections:

Reviewing Performance Information

The Performance tab displays the following charts:

Documents connexes

The document was helpful.

Sélectionner une évaluation

I easily found the information I needed.

Sélectionner une évaluation