The Java EE agent uses instrumentation for request monitoring and to collect single traces. This instrumentation does add some overhead to your monitored servers and the information collected indirectly applies load to the Foglight Management Server. However, if you only require single traces collected at component level, or you do not require request monitoring at all, you can reduce or turn off instrumentation using the Instrumentation Level setting. This reduces the overhead on your monitored servers and the load on the Foglight Management Server.
The default instrumentation level is FullDetail. At full detail level, request monitoring can be enabled and, when single traces are collected, all nodes in the call tree are included. This level provides the most flexibility in terms of request monitoring and single trace collection and should be acceptable for most customers.
If you require request monitoring, but do not require full detail single traces, instrumentation can be set to Component Detail. At component detail level, you can enable request monitoring, but when single traces are collected, they are collected at only the component technology detail level, reducing the complexity of the call tree. This level is more restrictive in what information can be collected for single traces, but reduces both the agent overhead on the monitored server and the load on the Management Server.
If you require request monitoring but only require request metrics for HTTP, JMS, and RMI requests, instrumentation can be set to Basic Detail. At this level, no breakdowns are collected and, if single traces are collected, only HTTP, JMS, and RMI nodes are included in the Request Trace call tree. No other component or full detail methods are collected, therefore reducing both the agent overhead on the monitored server and the load on the Management Server, compared to the Component Detail instrumentation level.
If you do not require request monitoring or the ability to capture single traces, instrumentation for this purpose can be disabled by setting the instrumentation level to No Detail. At this setting, request monitoring cannot be enabled and you are unable to capture single traces at any detail level. This removes instrumentation overhead on the monitored server and greatly reduces load on the Management Server.
|
1 |
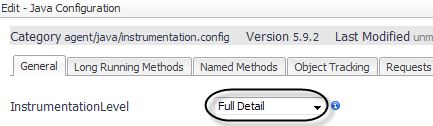
On the General tab of the Edit dialog box, select the instrumentation level from the InstrumentationLevel list. |
|
• |
Full Detail — Instruments at full detail level. All methods in the call tree are captured. |
|
• |
Component Detail — Instruments at the component level only. Methods from defined component technology, including custom components, are captured. |
|
• |
Basic Detail — Instruments at a basic level. Only request metrics for HTTP, JMS, and RMI request are collected. No other component or full detail methods are captured. |
|
• |
No Detail — Turns off instrumentation that is not essential for running an agent. As a result, no request metrics are collected, and single traces call trees cannot be captured. |
|
NOTE: As a result of setting instrumentation to this level, no data is displayed in the Application Servers Monitor > Requests tab. |
|
2 |
Click Save. |
If you manually edit the instrumentation.config file, use the following syntax to set the instrumentation level:
|
1 |
|
4 |
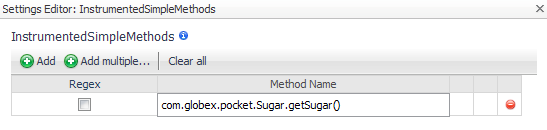
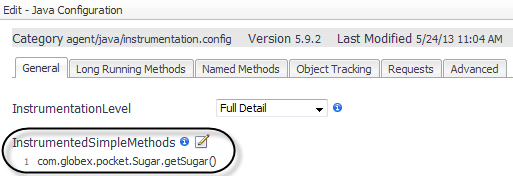
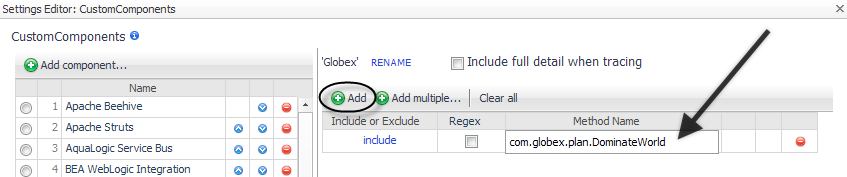
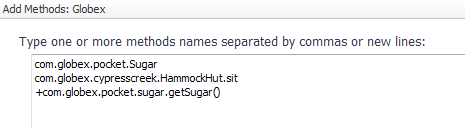
Click in the Method Name box and type the name of the method you want to instrument. For example, in the following image, the getSugar() method is instrumented even if it is detected as a simple method. |
|
5 |
Click OK. |
|
6 |
Click Save. |
If you manually edit the instrumentation.config file, use the following syntax to enable simple method instrumentation:
To explicitly name methods to be instrumented, even if they are detected as simple methods:
Use the User Classes setting to customize the classes that are treated as user or application code.
Excluding a class prevents the class from being instrumented as user code. It may still be partially instrumented if it implements important application server functionality (such as RMI communications).
Including a class ensures that the class is specified and instrumented as user code.
For more information about instrumented class and custom components, see: Customizing instrumented classes , and Changing custom component settings .
|
1 |
|
3 |
|
4 |
|
5 |
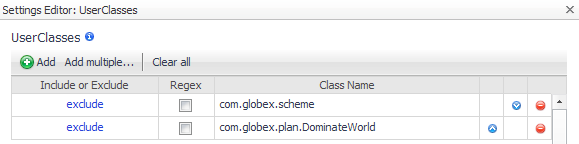
Click the Class Name box and type the name of the class you want to exclude. |

|
TIP: For more information about regular expressions, see the Appendix: Regular Expressions in the Foglight for Application Servers User Guide. |
|
6 |
In the Settings Editor dialog box, click OK to save your changes to the user class instrumentation. |
|
7 |
If you manually edit the instrumentation.config file, use the following syntax to enable user class or package instrumentation:
UserClasses = ClassList(
exclude "com.globex.plan.DominateWorld",
exclude "com.globex.scheme."
);
The class com.globex.plan.DominateWorld is excluded, as well as all classes in the package "com.globex.scheme".
Regular expressions can also be used to include or exclude classes. Also, multiple include and exclude elements can appear in the block, but it is the first element that matches that controls the outcome.
In this case, the class com.globex.plan.DominateWorld is included, but the class com.globex.pocket.Sugar is excluded because it matches the exclude pattern on the third line. Also, any classes in net.globex. package or the root globex. package are excluded since they match the exclude regular expression.
For more information about regular expressions, see the Appendix: Regular Expressions in the Foglight for Application Servers User Guide.
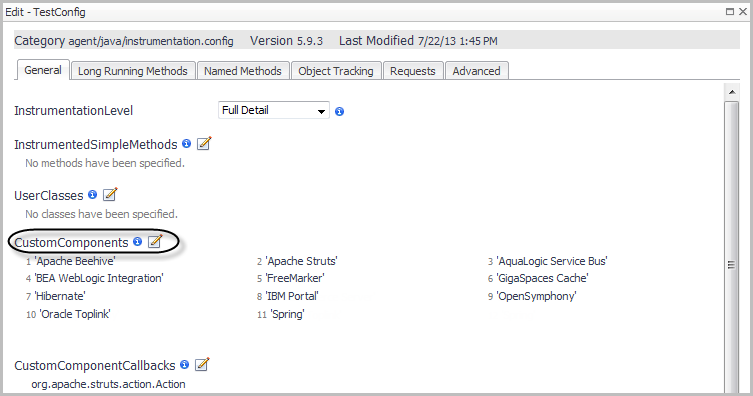
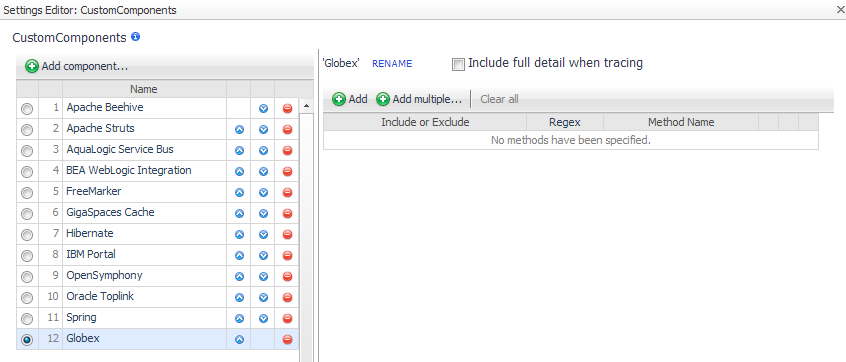
The Custom Components setting extends the default set of J2EE components to be included when recording a session at the Component Detail instrumentation level.
The method signature can be specified but it must be specified using the internal JVM format. For more information, see the Oracle Java SE Documentation: http://docs.oracle.com/javase/specs/#7035.
|
1 |
|
a |
Click |
|
4 |
If you manually edit the instrumentation.config file, use the following syntax to specify custom component instrumentation.
|
1 |
Edit CustomComponents. Specify the name of each component in a method list, either by entering the name or by forming a regular expression that matches the name or pattern. Enter the include element before each item in the list. For example: |
|
2 |
After editing the instrumentation.config settings, ensure that it is read by restarting the instrumented application servers. |