About the Hyper-V Explorer topology
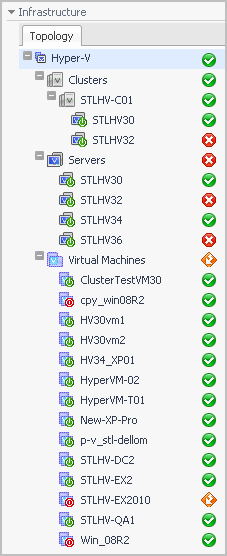
The Topology tab appears on the navigation panel when you access the Hyper-V Explorer. It displays a tree showing a hierarchical structure of the elements in your virtual infrastructure.

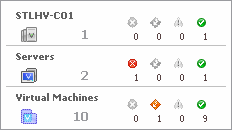
Use it to quickly select an object or object container and view the related information in the display area. Hovering over a specific node in this tree shows a dwell that gives you more information about that component, the related elements, and their alarm status. For example, hovering over a cluster node shows the name, the number of servers in that cluster, and the number of virtual machines running on the servers that belong to that cluster. It also shows the alarm counts for each component type and alarm severity.

Hyper-V Explorer Topology tab
The Hyper-V Explorer Topology tab contains an organized view of the virtual infrastructure objects that are monitored by Hyper-V Monitoring in Foglight Evolve Cloud: clusters, servers, and virtual machines.
This tab appears on the navigation panel, under Infrastructure.

Hyper-V Explorer Summary
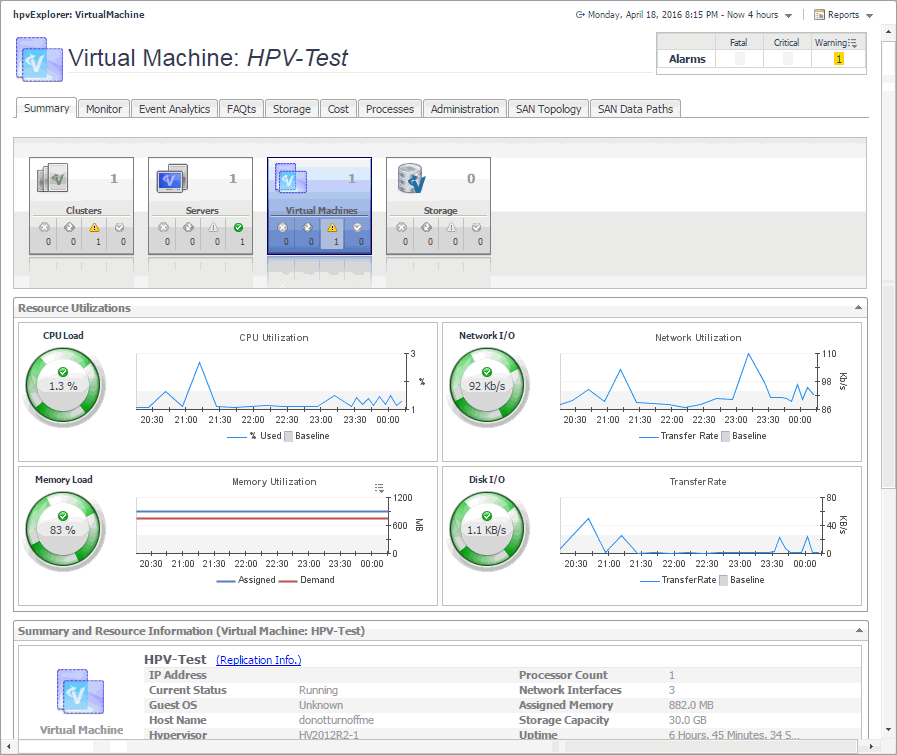
This is the first tab that appears open by default when you access the Hyper-V Explorer. It displays high-level information about the resource utilization and the selected component’s resources, such as its operating system, physical host, storage capacity, and others. The appearance of this tab depends on the object or group of object selected. For example, exploring a group of clusters shows a combined CPU consumption chart followed by a list of clusters, while exploring a virtual machine displays detailed resource consumption for the selected virtual machine.

Hyper-V Explorer Summary tab
The Hyper-V Explorer Summary tab shows a summary of system resources for a selected cluster, server, or virtual machine.
This tab appears in the Hyper-V Explorer when you select a cluster, server, or virtual machine instance on the Hyper-V Explorer Topology tab.

This tab is made up of the following embedded views:
|
|
Shows the resource consumption for the selected cluster, server, or virtual machine broken down into four simple views. |
|
|
|
• |
CPU Load. The current percentage of the selected component’s (cluster, server, or virtual machine) CPU load, used to execute system code and user programs, based on the total CPU capacity available to that component. | |
|
|
|
• |
CPU Utilization, % Used. The percentage of the selected component’s (cluster, server, or virtual machine) CPU utilization spent on executing system code and user programs during the selected time period. | |
|
|
|
|
|
|
• |
Disk I/O. The current disk I/O rate for the selected cluster, server or virtual machine. | |
|
|
|
• |
Disk Transfer Rate. The rate at which data was read from or written to the disks associated with the selected cluster, server, or virtual machine) during the specified time period. | |
|
|
|
|
|
|
• |
Memory, Static Memory. The total amount of static memory available to the selected cluster, server, or virtual machine. |
|
|
|
|
• |
Memory Load. The current percentage of the average memory usage by the selected cluster, server, or virtual machine. |
|
|
|
|
|
|
|
• |
Memory Utilization, Demand. The amount of memory that the selected cluster, server or virtual machine requires during the specified time period. |
|
|
|
|
• |
Network I/O. The current rate at which the selected component (cluster, server, or virtual machine) transfers data from and to the network. | |
|
|
|
|
|
|
• |
Network Utilization, Transfer Rate. The rate at which the selected component (cluster, server, or virtual machine) receives or sends data to the network during the selected time period. | |
|
|
Drill down on: |
|
|
|
• |
CPU Load spinner. Displays the CPU Load dialog box. |
|
|
|
|
|
|
|
• |
Disk I/O spinner. Displays the Disk I/O dialog box. |
|
|
|
|
|
|
|
|
|
|
|
|
|
• |
Network I/O spinner. Displays the Network I/O dialog box. |
|
|
|
|
|
|
Shows a list of servers that belong to the selected cluster.
|
|
|
|
• |
Server, CPU. The current percentage of the server’s CPU load, used to execute system code and user programs, based on the total CPU capacity. | |
|
|
|
• |
Server, Memory. The current percentage of the server’s memory usage by the selected component. | |
|
|
|
• |
Server, NICs. The number of network interface cards that the server uses. | |
|
|
|
|
|
|
• |
Server, Status. The server status, associated with any alarms raised against that server. If no alarms are fired, the status appears as Normal. Otherwise, the status is set to the alarm severity (Warning, Critical, or Fatal). | |
|
|
|
• |
Server, Version. The operating system version. | |
|
|
|
|
|
|
|
|
Drill down on any server entry. The Hyper-V Explorer dashboard appears, showing the server details on the Hyper-V Explorer Summary tab. |
|
|
Shows physical configuration details for the selected cluster, server or virtual machine. |
|
|
|
|
|
|
• |
Hypervisor. The name of the hypervisor application, Microsoft Hyper-V. | |
|
|
|
• |
Memory Capacity. The combined memory capacity of the servers that belong to the selected cluster. | |
|
|
|
• |
Network Interfaces. The number of network interface cards used by the servers that belong to the selected cluster. | |
|
|
|
|
|
|
• |
Processor Count. The number of CPUs used by the servers that belong to the selected cluster. | |
|
|
|
• |
Servers. The number of servers that belong to the selected cluster. | |
|
|
|
|
|
|
|
|
|
• |
Cluster. The name of the cluster to which the selected server belongs. | |
|
|
|
• |
Current Status. The current status of the selected server: Turned off or Running. | |
|
|
|
• |
Hypervisor. The name of the hypervisor application: Hyper-V. | |
|
|
|
• |
IP Address. The IP address of the selected server. | |
|
|
|
|
|
|
|
|
|
|
|
|
|
|
|
|
|
|
|
|
|
• |
Uptime. The length of time the selected server is running. | |
|
|
|
• |
Version. The version of the OS that is running on the selected server. | |
|
|
|
|
|
|
|
|
|
• |
Cluster. The name of the cluster to which the selected virtual machine belongs. | |
|
|
|
• |
Current Status. The current status of the selected virtual machine: Turned off or Running. | |
|
|
|
• |
Guest OS. The name of the operating system used by the selected virtual machine. | |
|
|
|
• |
Host Name. The host name of the selected virtual machine. | |
|
|
|
• |
Hypervisor. The name of the hypervisor application: Hyper-V. | |
|
|
|
• |
IP Address. The IP address of the selected virtual machine. | |
|
|
|
|
|
|
• |
Network Interfaces. The number of network interface cards used by the selected virtual machine. | |
|
|
|
|
|
|
|
|
|
• |
Uptime. The length of time the selected virtual machine is running. | |
|
|
The Hyper-V Explorer’s Virtual Environment view displays a high-level overview of your virtual environment. The view has a tile for each object type: Clusters, Servers, and Virtual Machines. Each tile shows how many of the corresponding object instances there are in your virtual infrastructure, as well as the count of objects of that type in each of the alarm states (Normal, Warning, Critical, Fatal). |
|
|
|
• |
Alarm counts. The total counts of alarms associated with the clusters, servers, or virtual machines, broken down by alarm types (Normal, Warning, Critical, Fatal). | |
|
|
|
• |
Cluster count. The number of clusters in your virtual environment. | |
|
|
|
• |
Server count. The number of physical servers in your virtual environment. | |
|
|
|
|
|
Drill down on: |
|
|
|
• |
Clusters. Displays the Clusters dwell, showing the names and states of all clusters in your environment. |
|
|
|
|
• |
Servers. Displays the Servers dwell, showing the names and states of all servers in your environment. |
|
|
|
|
• |
Virtual Machines. Displays the Virtual Machines dwell, showing the names and states of all virtual machines in your environment. |
|