How to Get Here
To open the Database home page, from the Databases dashboard, find the database you want to explore and click the instance name (or click  and select Overview). The Databases > Overview dashboard opens with a summary of the selected database.
From the Database home page, you can drill down to other pages that display more detailed metrics about the database.

The following summary and drill-downs pages are provided:
Summary
By default, the Summary view is displayed on the Database home page. The Summary contains the following panes:
The Database Overview pane displays metrics that provide an overview of the status of the entire database, over the course of the selected time range. For a partitioned database, this pane also provides a way to examine the balance of certain individual metrics across the members. The pane is at the left of the Database home page.
|
|
|
|
|
|
• |
Response Time (ms). The average response time of a query when the connection is already open, over the course of the selected time range. | |
|
|
|
• |
Avg. Request Time (ms). The average duration for a single database request, over the course of the selected time range. This metric is only available for DB2 v9.7.0.1 and later. | |
|
|
|
• |
Balance Criterion. The level of balance exhibited, for a particular database criterion (for example, workload in terms of the number of connections), over the course of the selected time range. Click the arrow at the right of “Balance Criterion” to choose a different criterion from the list. | |
|
|
|
• |
Workload. The balance of average active agents across the database members. If most of the activity is on one member, for example, the activity is not balanced. If most of the activity is spread equally across the members, it is balanced. | |
|
|
|
• |
Request Time. The balance of requests across the monitored members, or the extent to which the total request time is spread across the members. This metric is only available for DB2 v9.7.0.1 and later. | |
|
|
|
• |
Physical Reads. The balance of the physical reads across the monitored members, or the extent to which the physical reads operations are balanced across the members. | |
|
|
|
• |
Logical Reads. The balance of the logical reads across the monitored members, or the extent to which the logical reads operations are balanced across the members. | |
|
|
|
• |
CPU Load. The balance of CPU used across the monitored members. | |
|
|
|
• |
Transaction Rate. The balance of the transactions across the monitored members. For example, if most of the transactions are done on one member, the transactions are not balanced. If they are spread equally across the members, they are balanced. | |
|
|
|
|
|
Clicking the icon next to the Availability, Response Time, or Avg. Request Time metric displays a pop-up that provides additional, related information.
Mousing over a data point on either of the Balance Criterion charts displays a pop-up that provides more detailed information about that data point.
Clicking any of the Request Time, Physical Reads, Logical Reads, CPU Load, Transaction Rate, or Storage Capacity charts displays a pop-up that provides additional, related information. |
The Sessions pane displays client application session metrics for the entire database. It is at the lower left of the Database home page.
The FCM pane displays FCM metrics for the entire database. It is located in the upper middle of the Database home page.
The Cache Hit Ratio pane displays cache hit ratio metrics for the entire database. It is located toward the center of the Database home page.
|
|
|
• |
Buffer Pool (%). The percentage of database page I/O requests satisfied using the buffer cache (and therefore the database did not have to perform disk reads), over the course of the selected time range. | |
|
|
|
• |
Package (%). The number of times that a requested section was not available for use and had to be loaded into the package cache. Calculated as a percentage of the total number of times that a section was requested, over the course of the selected time range. | |
|
|
|
• |
Catalog (%). The number of times that a table descriptor or authorization information was not found in the catalog cache and had to be inserted ther. Calculated as a percentage of the total number of times that a table descriptor or authorization information was requested, over the course of the selected time range. | |
|
|
|
• |
pureScale only — Overall BP (%). A percentage that reflects the number of times a requested page was found in the buffer pool out of all times it was requested. If a page is found in the buffer pool, it saves the database the time to look for it in the physical storage. | |
|
|
|
• |
pureScale only — Global BP (%). A percentage that reflects the number of times a requested page was found in the GBP out of all times it was requested. If a page is found in the GBP, it saves the database the time to look for it in the LBP. | |
|
|
|
• |
pureScale only — GBP Full (%). A percentage that reflects the number of times a Group Buffer Pool Full condition occurred per 10,000 commits . | |
|
|
|
The Resource Utilization pane provides information on CPU and RAM consumption for the entire database. It is located in the lower middle of the Database home page.
The Storage pane provides information about fixed and auto storage for the entire database. It is at the upper right of the Database home page.
|
|
|
• |
Fixed Size (MB). The total disk space that is available for use by fixed-size tablespaces and the disk space that is still free to be used by fixed-size tablespaces. | |
|
|
|
• |
Auto Storage (MB). The total file system space that is available for the database to use to carry out auto storage tablespace operations, and the file system space that is still free for the database to use to carry out auto storage tablespace operations. | |
|
|
|
• |
Clicking the Investigate using the “Tablespaces” drilldown link at the bottom of either pop-up takes you to the Tablespaces dashboard for additional information. | |
The Average I/O Activity pane provides I/O metrics for the entire database. It is at the lower right of the Database home page.
SQL Performance
SQL Performance page provides the ability to investigate the activity and resource consumption of a selected database or database partition.
The SQL Performance page displays the following components:
Selecting different levels in the History Tree to display different views in the History section view. For details, see Database (or Partition) View, SQL Statements View, or Single Statement View.
The History section view is divided into two sections that are correlated to each other:
|
• |
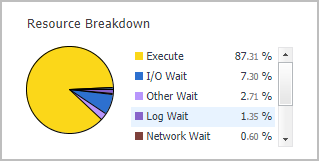
Workload chart — Displays the database (or Partition) resource activity over the selected time frame by emphasizing the resources by colors. |
|
• |
Baseline chart — Displays the database (or Partition) workload compared to the baseline over time.  |
|
• |
Breakdown chart — Rate of activity of the database (or Partition) per second.  |
|
• |
Metrics Overview - Displays a graphical representation of the metrics highlighted in the Workload related Metrics table below. 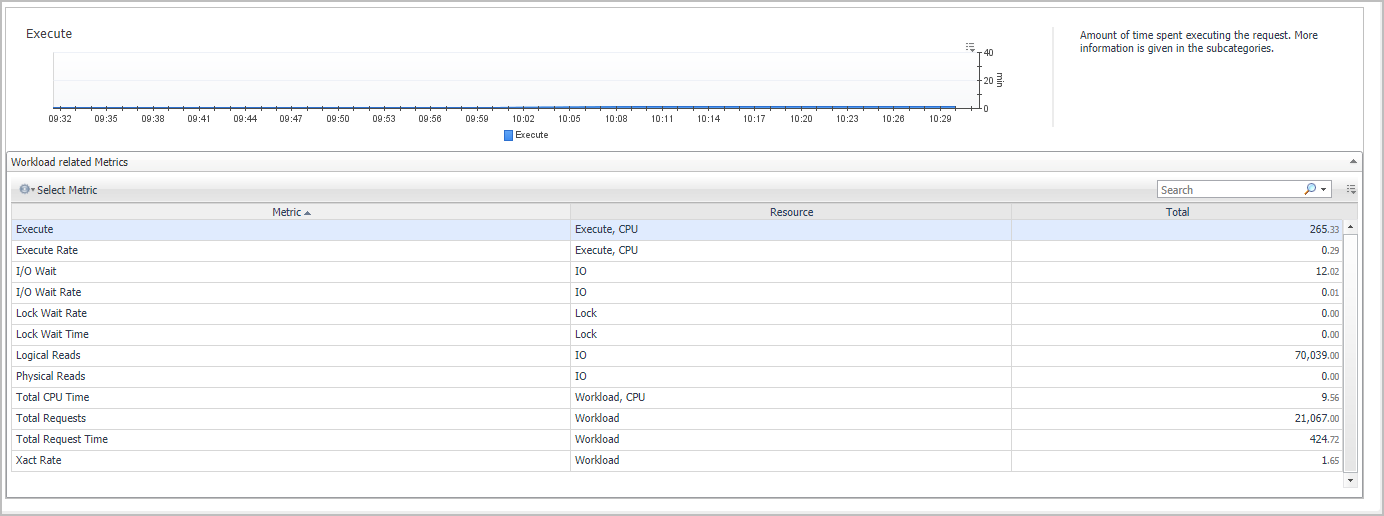 |
|
• |
Workload related Metrics - A table that displays a variety of resource consumption metrics which can give an in-depth of the database/partition activity. Metrics are categorized by resource and the resource name can be used to filter the table by writing its name in the search box. |
|
|
|
|
Total Requests |
The total amount of requests completed. |
|
Total Requests Time |
The total amount of time spent working on requests. This value is reported in Seconds. |
|
Total Requests Time Rate |
The rate of time spent working on requests per second. This value is reported in Seconds/s. |
|
Total CPU Time |
The total amount of CPU time used while within DB2®. Represents total of both user and system CPU time. This value is reported in Seconds. |
|
Total CPU Wait |
The total time that requests, that were run in this service class, spent waiting to access the CPU. This value is given in seconds. Available for version 10 and above. |
|
FCM Receive Volume |
The total amount of data received via the FCM communications layer. This value is reported in bytes. |
|
FCM Send Volume |
The total amount of data distributed by the FCM communications layer. This value is reported in bytes. |
|
FCM Receive Volume Rate |
The rate of data received via the FCM communications layer per second. This value is reported in bytes/s. |
|
FCM Send Volume Rate |
The rate of data distributed by the FCM communications layer per second. This value is reported in bytes/s. |
|
TCP/IP Send Volume |
The amount of data sent by data server to client. This value is reported in kbytes. |
|
TCP/IP Send Volume Rate |
Number of kbytes sent by the data server to clients per second. |
|
TCP/IP Receive Volume |
The amount of data received by the data server from clients over TCP/IP. This value is reported in kbytes. |
|
TCP/IP Receive Volume Rate |
Number of kbytes received by the server from clients per second. |
|
Physical Reads |
Total physical reads (index, XDA and data) in the bufferpool. |
|
Logical Reads |
Total logical reads (index, XDA and data) in the bufferpool. |
|
Xact Rate |
The number, per second, of transactions that were carried out during the specified time range. |
|
Lock Waits |
The number of times that applications or connections waited for locks. |
|
Lock Escalation |
The number of times that locks have been escalated from several row locks to a table lock. |
|
Lock Timeouts |
The number of times that a request to lock an object timed-out instead of being granted. |
|
Deadlocks |
A deadlock occurs when there is a cyclic dependency between two or more threads, or processes, which contend for the same set of resources within DB2, namely: each task has a lock on a resource which the other tasks are trying to lock. |
|
I/O Wait |
Amount of time spent waiting for I/O. Subcategories specify further information. |
|
I/O Wait Rate |
The rate of total time spent waiting for I/O per second. |
|
Lock Wait Time |
Amount of time spent waiting for locks. |
|
Lock Wait Rate |
The rate of total time spent waiting for locks per second. |
|
FCM Wait |
Amount of time spent waiting for the FCM communications layer. |
|
FCM Wait Rate |
The rate of total time spent waiting for the FCM communications layer per second. |
|
Network Wait |
Amount of time spent waiting on network protocols. More information is given in the subcategories. |
|
Network Wait Rate |
The rate of total time spent waiting on network protocols per second. |
|
Log Wait |
Amount of time spent waiting on the log. More information is given in the subcategories. |
|
Log Wait Rate |
The rate of total time spent waiting on the log per second. |
|
pureScale Wait |
Amount of time spent waiting for various functions within the cluster. More information is given in the subcategories. |
|
pureScale Wait Rate |
The rate of total time spent waiting for various functions within the cluster per second. |
|
Memory Wait |
Amount of time spent waiting on an internal latch. |
|
Memory Wait Rate |
The rate of total time spent waiting on an internal latch per second. |
|
Other Wait |
Aggregate several events not usually with high impact on performance. More information is given in the subcategories. |
|
Other Wait Rate |
The rate of total time spent aggregating several events not usually with high impact on performance per second. |
|
Execute Time |
Total time spent executing routines and performing section execution. Processing time does not include wait time. |
|
Execute Time Rate |
The rate of total time spent executing routines and performing section execution per second. |
|
Compile |
Amount of time spent doing explicit or implicit compiles. |
|
Compile Rate |
The rate of total time spent doing explicit or implicit compiles per second. |
|
Transaction |
Amount of time spent on commit or rollback of transaction. |
|
Transaction Rate |
The rate of total time spent on commit or rollback of transaction spent per second. |
|
Administration Time |
Amount of time spent processing administration tasks (index build, backup, load and reorg). |
|
Administration Time Rate |
The rate of total time spent on processing administration tasks' spent per second. |
For details, refer to Resource consumption charts under Database (or Partition) View.
The Top SQL Statements table displays the top SQL statements by their overall active time during the selected time range. The number of SQL statements displayed is shown at the table's title. Selecting a row displays the CPU workload and executions of the selected SQL statement on the SQL Activity section below. For details, see SQL Activity section. Selecting the SQL Text in the SQL Statements tree panel displays a page that allows viewing detailed information about the selected SQL statement.
The table below lists the Top SQL Statements name and their descriptions:
|
|
|
|
SQL Text |
The SQL text for the selected SQL statement. |
|
Executions |
The number of times that an SQL statement has been executed. |
|
Total Execution Time (seconds) |
The total time in seconds that was spent executing the particular statement. Not including time spent executing routines used as part of the statement. |
|
Avg Execution Time (seconds) |
The average time in seconds that was spent executing the particular statement Not including time spent executing routines used as part of the statement. |
|
CPU Time (seconds) |
The total CPU time consumed by the statement in the selected timeframe. |
|
Rows Read |
The number of rows read from the table. This element helps you identify tables with heavy usage for which you may want to create additional indexes. |
|
Rows Modified |
The number of rows changed (inserted, deleted or updated) by the statement. A high value for table-level information indicates there is heavy usage of the table and you may want to use the Run Statistics (RUNSTATS) utility to maintain efficiency of the packages used for this table. |
|
Rows Returned |
The number of rows that have been selected and returned to the application. If this number is significantly lower than “Rows read”, then it might indicate an index is missing. |
|
Wait Time (%) |
Percent of time spent waiting within the DB2® database server out of the total time spent actively working on requests. |
|
Total Dispatcher Queue Wait (seconds) |
The total time that requests, that were run in a service class, spent waiting to access the CPU. |
|
I/O Wait (seconds) |
Total time spent waiting, while processing an I/O request. Include read and write operations, both direct and from memory pools. |
|
Execute (seconds) |
Total time spent executing routines and performing section execution. Processing time does not include wait time. |
|
Log Wait (seconds) |
Total time spent waiting for log records to be flushed to disk or waiting for space in the log buffer. |
|
FCM Wait (seconds) |
The time spent waiting for an FCM message to be sent or FCM reply to be received. |
|
Max Query Cost Estimate |
The maximum estimated cost of a query out of all cost estimations collected for the query in the timeframe selected. Query cost estimation is determined by the SQL compiler. This value is reported in timerons. |
|
Lock Wait (seconds) |
The time spent waiting for locks. |
|
Total Sort Time (seconds) |
Total amount of time spent performing sorts while executing a section, which is the execution of the compiled query plan generated by the SQL statement. |
|
Other Wait (seconds) |
Total time spent waiting for miscellaneous events such as audit records writes, dialog writes, event monitor records and send or receive data from an in-database analytics process. |
|
WLM Wait (seconds) |
The time spent waiting on a WLM queuing threshold. |
|
Compile Time (seconds) |
The overall amount of time that was required to prepare the specific SQL statement in the time frame selected. |
|
Memory Wait (seconds) |
The amount of time, spent in extended latch waits. |
|
purescale Wait (seconds) |
In a DB2® pureScale® environment, this is the time spent waiting for communicating with the cluster caching facility or waiting for page locks, where the lock request caused a page to be reclaimed either locally or from another member. |
Located below the table of Top SQL Statements, the SQL Activity section of the pane displays the CPU workload and executions of the SQL statement selected, compared to the overall workload and CPU used by all statements in the database/partition.
These metrics are visually represented in two graphs:
|
• |
Overall CPU Workload — the CPU usage incurred by the total SQL statements run in the database/partition level. |
|
• |
Executions — Displays the number of times the selected SQL statement and all of the database (or partition) executed SQL statement in the specified time range. This graph compares the following metrics: |
|
• |
Overall Executions – The number of the total SQL statements run in the database/partition level. |
To view detailed graphic and textual data about a specific SQL statement, select the SQL statement from the statements listed in the History Tree. This page contains the following panes:
The SQL Activity pane displays the CPU workload and executions of the selected SQL statement, as well as all SQL statements displayed in the History Tree on the page left side. This pane is identical to the SQL Activity section in the SQL Statements Page.
The SQL Text pane displays an overview of the selected SQL statement text. In addition, the pane includes the following button:
|
• |
View Full Text - Displays a pop-up with the SQL Statement text, whose maximum size is by default 2048 characters.  |
The SQL Metrics table displays details about the selected SQL statement.
The table below lists the SQL metrics name and their descriptions:
|
|
|
|
Total Execution Time (seconds) |
The total time in seconds that was spent executing the particular statement. Not including time spent executing routines used as part of the statement. |
|
Deadlocks |
The number of times that a request to lock an object resulted in a deadlock. |
|
Sort Overflows |
The total number of sorts that ran out of sort heap and may have required disk space for temporary storage. |
|
Rows Read |
The number of rows read from the table. This element helps you identify tables with heavy usage for which you may want to create additional indexes. |
|
Rows Modified |
The number of rows changed (inserted, deleted or updated) by the statement. A high value for table-level information indicates there is heavy usage of the table and you may want to use the Run Statistics (RUNSTATS) utility to maintain efficiency of the packages used for this table. |
|
Rows Returned |
The number of rows that have been selected and returned to the application. If this number is significantly lower than “Rows read”, then it might indicate an index is missing. |
|
Total CPU Time (seconds) |
The total CPU time consumed by the statement in the selected timeframe. |
|
Total Wait Time (seconds) |
The total time spent waiting within the DB2® database server out of the total time spent actively working on requests. |
|
Execute (seconds) |
The number of times that an SQL statement has been executed. |
|
FCM Wait (seconds) |
The time spent waiting for an FCM message to be sent or FCM reply to be received. |
|
I/O Wait (seconds) |
Total time spent waiting, while processing an I/O request. Include read and write operations, both direct and from memory pools. |
|
Memory Wait (seconds) |
The amount of time, spent in extended latch waits. |
|
Lock Wait (seconds) |
The time spent waiting for locks. |
|
Log Wait (seconds) |
Total time spent waiting for log records to be flushed to disk or waiting for space in the log buffer. |
|
pureScale Wait (seconds) |
In a DB2® pureScale® environment, this is the time spent waiting for communicating with the cluster caching facility or waiting for page locks, where the lock request caused a page to be reclaimed either locally or from another member. |
|
Other Wait (seconds) |
Total time spent waiting for miscellaneous events such as audit records writes, dialog writes, event monitor records and send or receive data from an in-database analytics process. |
|
Total Sort Time (seconds) |
Total amount of time spent performing sorts while executing a section, which is the execution of the compiled query plan generated by the SQL statement. |
|
Compile Time (seconds) |
The overall amount of time that was required to prepare the specific SQL statement in the time frame selected. |
|
Executions |
The number of times that an SQL statement has been executed. |
|
Sorts |
The total number of times that a set of data was sorted in order to process the statement operation. |
|
Avg Response Time (seconds) |
The average response time of a single statement execution. |
The Pie Charts pane includes the pie charts listed below, which display the activity during the selected time range for the selected metrics.
|
• |
Total CPU Time — The total CPU time consumed for executing the selected SQL statement, compared with the CPU time consumed for executing all of the SQL statements. 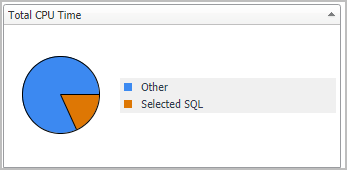 |
|
• |
Sort Time —The total time spent on the selected SQL statement’s data sorts, compared with the sort time spent to carry out other database processes. 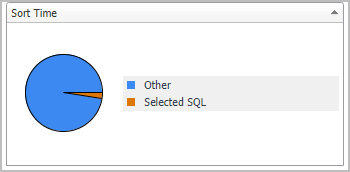 |
|
• |
Logical Reads —The total number of logical reads for the selected SQL statement, compared with the total SQL statements. 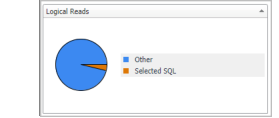 |
|
• |
Physical Reads —The total number of physical reads for the selected SQL statement, compared with the total SQL statements.  |
Activity Drill-downs
On the Database home page toolbar, click Activity and select one of the following views:
Provides information about the performance of the tables in the selected database.
By default, the Top Tables pane lists performance metrics for the top 10 tables of the selected database in order of rows read. You can configure the pane to list the top 10, 15, or 20 tables listed in order of rows read, rows written, overflows, or page reorganizations.
Select tables from the list to compare their selected activity metrics on the charts at the bottom of the pane.
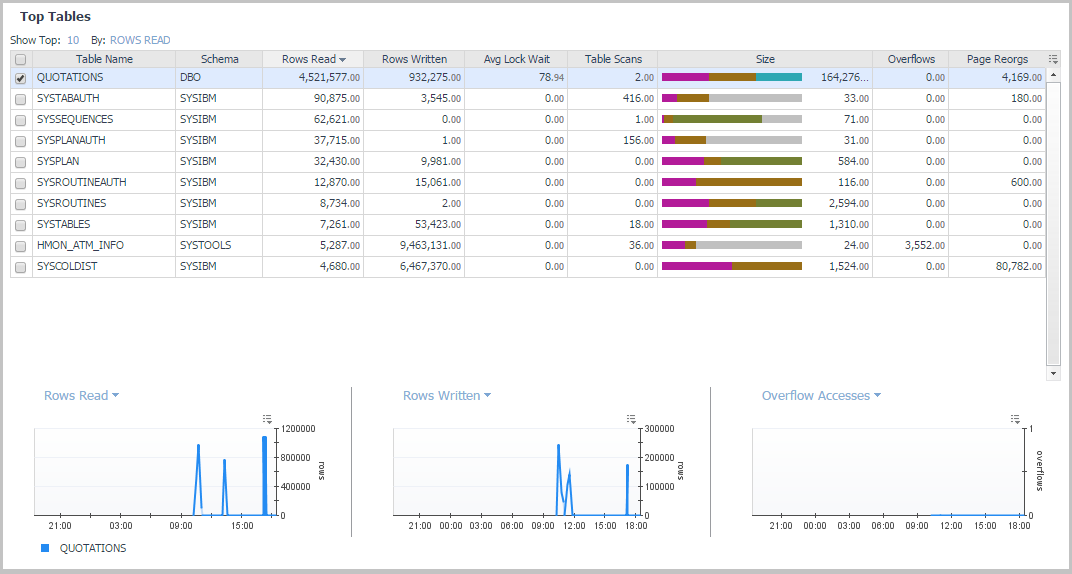
On the Database home page toolbar, click Activity and select Top Tables.
|
|
|
|
|
|
• |
Schema. The schema of the monitored table. Used with Table Name, this element can help in determining the source of a contention for resources. | |
|
|
|
• |
Table Type. The type of table for which information is returned. | |
|
|
|
• |
Rows Read. The number of rows in the table that are read from in order to process the selected SQL statement. | |
|
|
|
• |
Table organization. Organization method of the data in the table. 'R' indicates data is row-organized, 'C' indicates column-organized. | |
|
|
|
• |
Number of columns. Number of columns defined for the table as appears in the catalog. | |
|
|
|
• |
Rows Written. The number of rows in the table that are changed (inserted, updated, or deleted) in order to process the selected SQL statement. | |
|
|
|
• |
Overflows. The total number of accesses (reads and writes) to overflowed rows of the table. | |
|
|
|
|
|
|
• |
Avg Num Column Referenced - Average number of column referenced in each access to the table. Available from v10.5 and above when the mon_obj_metrics parameter is set to extended. | |
|
|
|
• |
Table scans - The number of scans performed on the table in the selected time frame. Available from version 9.7 and above. | |
|
|
|
• |
Size - Total size of table in pages separated to the various page types: Data, Index, Xda, Lob, Long and Col | |
|
|
|
• |
Page Reorgs. The number of page reorganizations run for the table during the specified time range. | |
|
|
|
• |
Tablespace Id. The integer used by the selected database to uniquely represent this tablespace. | |
|
|
|
• |
Data. The total number of disk pages the table consumes. This number represents the base table size only. Space consumed by index objects, LOB data, and long data is displayed in the Index, Lob, and Long columns, respectively. | |
|
|
|
• |
Index. The total number of disk pages consumed by all indices defined in the table. | |
|
|
|
• |
Lob. The total number of disk pages consumed by LOB data in the table. | |
|
|
|
• |
Long. The total number of disk pages consumed by LONG data in the table. | |
|
|
|
• |
Xda. The total number of disk pages consumed by XML storage object (XDA) data in the table. | |
|
|
|
|
|
|
|
|
|
|
|
|
|
|
|
|
|
Displays the same metrics in chart form. |
Provides current and historical metrics on locks held in the selected database.
On the Database home page toolbar, click Activity and select Locks.
You can also access the Locks pane for a database from the Databases Dashboard. Click the icon at the far right of the database name cell and selecting Locks from the menu that appears.
This view provides the following embedded views:
Displays a selection of lock metrics from the Current Locks Wait Collection.

Displays the global lock metrics from the CF Locks Collection.

|
|
|
• |
Agent ID. 16-bit counter of a system-wide unique ID for the locked wait application. | |
|
|
|
• |
Member Num. The database member from which the data was retrieved for this row. | |
|
|
|
• |
Lock Mode. Indicates the lock type being held and is used to determine what is the source of the lock contention. | |
|
|
|
• |
Lock Object Type. The object type held by the application that helps determine resource contention. | |
|
|
|
• |
Lock Wait Start Time. Date and time the lock started waiting to receive a lock, that had another application lock it. | |
|
|
|
|
|
|
|
|
|
|
|
|
|
|
|
|
|
|
• |
Appl ID Holding Lock. Application ID of the application holding a lock on the object that the application waits to obtain. | |
|
|
|
|
|
|
• |
Lock Attributes. The attributes of the lock. The text identifier of Y is used if there are no locks. | |
|
|
|
|
|
|
• |
Lock Escalation. Indicates whether a lock request was made as part of a lock escalation. | |
|
|
|
|
|
|
|
|
|
• |
Subsection Number. This number relates to the subsection number in the access plan that can be obtained with db2expln. | |
|
|
|
• |
Data Partition ID. Identifies the data partition for returned information and is only used by partitioned tables. The return information represents a value of -1. | |
The Current Agents pane displays agent workload, agent activity, and CPU usage.
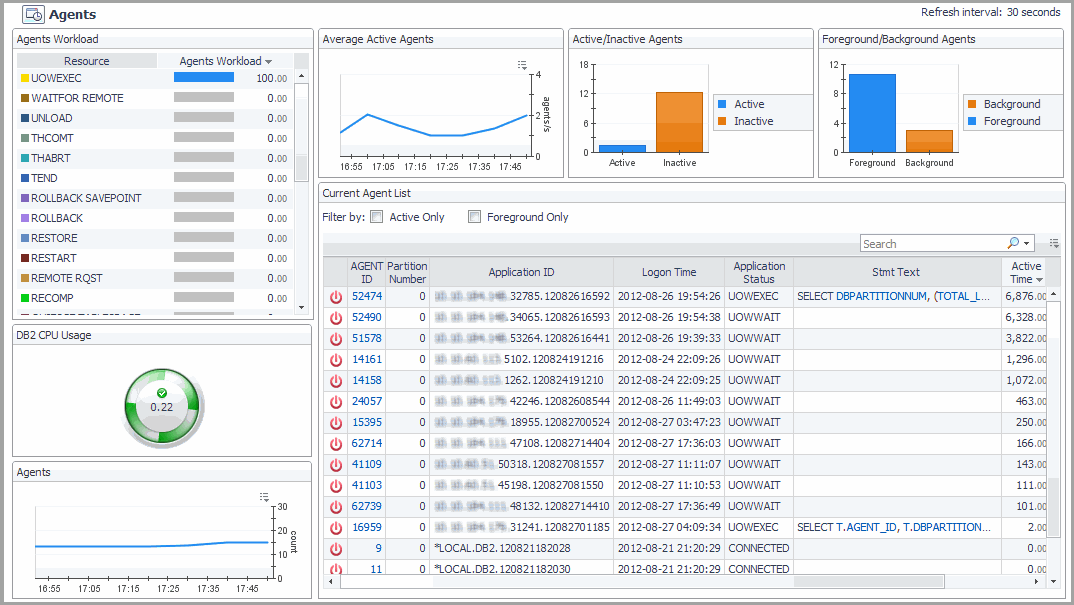
On the Database home page toolbar, click Activity and select Current Agents.
You can also access the Current Agents pane for a database from the Databases Dashboard. Click the icon at the far right of the database name cell and selecting Current Agents from the menu.
This view provides the following embedded views:
|
|
Resource. Lists the agent workload resources. |
|
|
Agent Workload. Displays how much the listed resource uses the agent. |
|
|
BACKUP. Indicates the database is being backed up. |
|
|
COMMIT. Indicates a work unit is committing its database changes. |
|
|
COMP. Reports that the database manager is doing a compilation of a SQL statement or planning a precompiling a plan for the application. |
|
|
CONNECTPEND. Reports that the application has started to connect to the database and the connection request is not finished. |
|
|
CREATE_DB. Tells the user that a database is being created. An agent initiation request has started to create the database, but the request is not complete. |
|
|
DECOUPLED. The agent has been decoupled and no agents are associated with the application running. This state is normal. If the connection is enabled, no dedicated agents exist. Applications can be decoupled on the coordinating partition. In environments that are non-concentrated, applications are not decoupled and a dedicated coordinator agent is always running. |
|
|
DISCONNECTEDPEND. Tells the user that the application is in the process of disconnecting, however a command has not finished execution. An application might have begun the disconnection command. The database manager must disconnect from the database if an application finishes and no disconnection has taken place. |
|
|
INTR. Tells the user that an interruption of a request is taking place. |
|
|
LOAD. Tells the user that an application is doing an expedited loading of data to a database. |
|
|
LOCKWAIT. Data being processed is standing by for a lock. When the lock is received, its status goes back to its previous value. |
|
|
QUIESCE TABLESPACE. A quiesce tablespace request is taking place. |
|
|
RECOMP. A database manager is recompiling or rebinding the application. |
|
|
REMOTERQST. A federating data source is in the process of providing results to the application. |
|
|
RESTART. After a crash, the database is starting back-up and performing a recovery. |
|
|
RESTORE. A backup image of the database is being restored. |
|
|
ROLLBACK. The database is rolling back changes. |
|
|
ROLLBACK SAVEPOINT. The database is rolling back changes to a certain saving point in the database. |
|
|
TEND. Work that belongs to a global transaction has ended. This work has not committed to the preparation phase required by the two-step protocol commitment. |
|
|
THABRT. This work belongs to a global transaction rolled-back based on speculation. |
|
|
THCOMT. This work belongs to a global transaction committed, based on speculation. |
|
|
UOWEXEC. Work is being processed by the database manager upon request. |
|
|
UNLOAD. The database is doing an accelerated unloading of data. |
|
|
UOWEXEC. Requests are being processed by the database manager. |
|
|
UOWWAIT. The application is processing data for the database manager. Tells the user that application code is in the process of running. |
|
|
WAITFOR REMOTE. A partitioned database instance is standing by for a reply from a remote partition. |
|
|
agents/s. The number of active agents per second (Average active sessions). |
|
|
Active. The number of active agents. |
|
|
Inactive. The application is at one of three statuses: Connected, Wait or Decoupled. |
|
|
Count. Displays the number of running agents during the specified time range. |
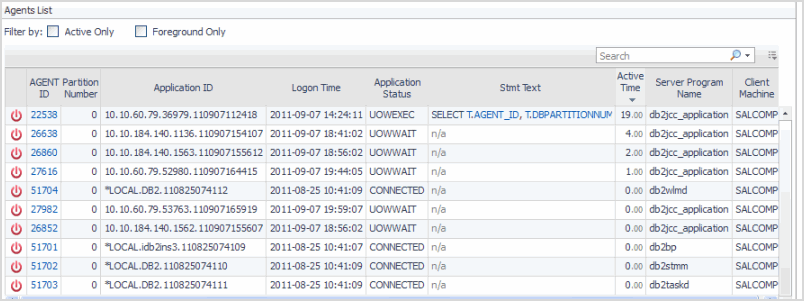
Displays detailed agent metrics.
|
|
|
|
|
|
|
|
|
|
|
|
|
|
|
|
|
|
|
|
|
|
|
|
|
|
|
|
|
|
• |
CPU. The total CPU time used by database manager agent process. | |
|
|
|
• |
Client PID. The process ID of the client application that made the connection to the database. | |
|
|
|
• |
Coord PID. The process ID (UNIX systems) or thread ID (Windows systems) of the coordinator agent for the application. | |
|
|
|
Displays user-defined metrics tailored to your database monitoring requirements. For procedures on defining user-defined collections, see Adding User-defined Collections.
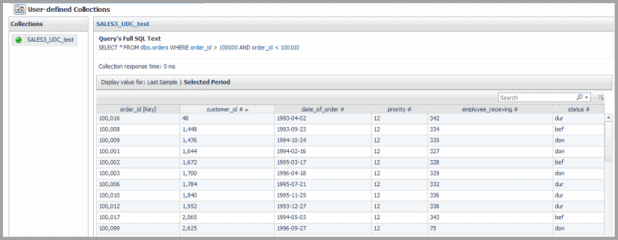
On the Database home page toolbar, click Activity and select User-defined Collections.
and select Overview). The Databases > Overview dashboard opens with a summary of the selected database.


