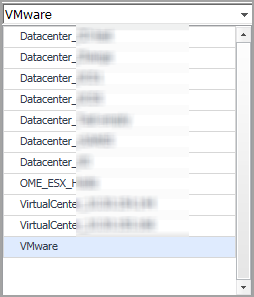
Group selector
Actions bar
The actions bar at the top of the Capacity Management tab contains the following options, “Analysis” and “Recalculating Results”.
Analysis
|
• |
Baseline For Forecasting: Defines the historical period used for the calculations of metric views, current capacity, and recommended resources in the Resource Utilization view. The following options are available: 30 Days Trending (default option), 180 Days Trending, and 365 Days Trending. |
|
• |
Time Frame: Defines the predicted period for calculating metric views, current capacity, and recommended resources in the Resource Utilization view. The following options are available: Next 30 Days (default option), Next 60 Days, Next 90 Days, and Next 180 Days. |
|
• |
Average Analysis Period: Defines the historical period used for the calculations of the Slot Size, Slot Available, and Constraint in the Current Capacity view. |
|
• |
Show Getting Started (Use Cases): Select this check box to show the Getting Started tab, or clear this check box to hide the Getting Started tab. |
|
3 |
Click Save. |
Recalculating Results
Foglight Capacity Manager allows you to get the latest analytical results for the Current Capacity view and the Resource Utilization view, based on the data collected by the VMware Performance Agents. To get the latest analytic results, click the Recalculate menu on the actions bar.
|
NOTE: Results populated in Current Capacity > Clusters, Resource Utilization > Clusters, and Resource Utilization > Hosts and Workload are impacted if the High Availability (HA) policy is enabled in the vCenter®. |
The Recalculation Results dialog includes the following recalculating results:
|
• |
Current Capacity: Capacity of the vCenter® or datacenter, average/maximum slot size for clusters, available slots, and constraint. |
|
• |
Resource Utilization: History data and forecasting data. |

