Tchater maintenant avec le support
Tchattez avec un ingénieur du support

Foglight for Sybase 5.7.5.40 - User and Reference Guide

Using Foglight for Sybase
Exploring the Sybase Dashboards About the Sybase_MDA Agent About the Sybase_RS Agent Generating SybaseMDA Reports
Reference About us

Data Caches Spinlocks Tab

Previous Next


Data Caches Spinlocks Tab

This dashboard shows the Spinlocks that occurr for each Data Cache. Use this dashboard for detecting data cache that may suffer a contention and monitor it over time.

The table columns are the same as in Spinlocks table in Spinlocks Tab.


Database Spaces and Trends Dashboard

Previous Next


Using Foglight for Sybase > Exploring the Sybase Dashboards > Database Spaces and Trends Dashboard

Database Spaces and Trends Dashboard

The Database Spaces and Trends dashboard shows details about databases and table spaces and the overall trends. This dashboard contains the following tabs:

DB Spaces Tab

Previous Next


DB Spaces Tab

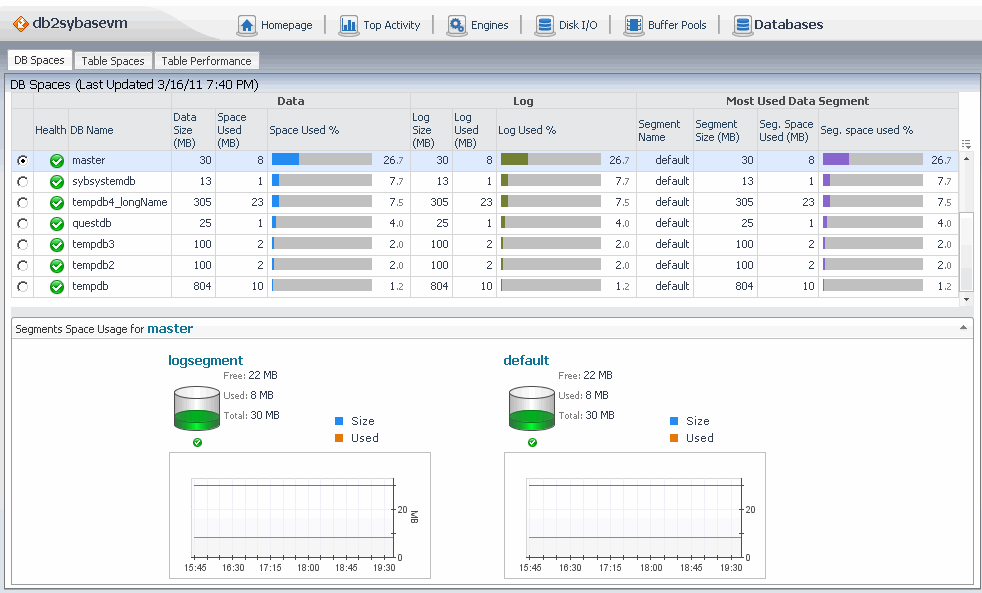
Device activity information is provided in a table and a chart:

Figure 30. DB Spaces Tab

DB Spaces Table

Table 48. DB Spaces Tabe Description

Name

Description

Option button

Shows additional information about the selected database in the Segment Space Usage Composite View.

Data

Health

The state of the database health, indicated by the alarm of the highest severity generated against the database. Hovering over this column results in a message box showing the alarm message.

Data Size (MB)

The total amount of space in MB that is available to the database.

Space Used (MB)

The amount of space used by the database.

Space Used %

The percentage of the database space currently in use, shown as a number and a graphic indicator

Log

Log Size (MB)

The total amount of space in MB that is available to the database log.

Log Used (MB)

The amount of space used by the database log.

Log Used %

The percentage of the database log currently in use, shown as a number and a graphic indicator.

Most Used Data Segment

Segment Name

The name of the database segment that is most used/

Segment Size (MB)

The total amount of space in MB that is available to the database segment.

Seg. Space Used (MB)

The amount of space used by the database segment.

Seg. space used %

The percentage of the database segment currently in use, shown as a number and a graphic indicator.

Segment Space Usage Composite View

This composite view contains information about space usage for each segment of the database selected in the DB Spaces Table.

Table 49. Segment Space Usage Composite View Description

Name

Description

Current segment usage

Free

The amount of the segment space that is currently not in use.

Used

The amount of the segment space that is currently in use.

Total

The total amount of space that is available to the database segment.

Segment usage over time (chart)

Size

The total amount of space that is available to the database segment, shown over time.

Used

The amount of the segment space that is currently in use, shown over time.

Table Spaces Tab

Previous Next


Table Spaces Tab

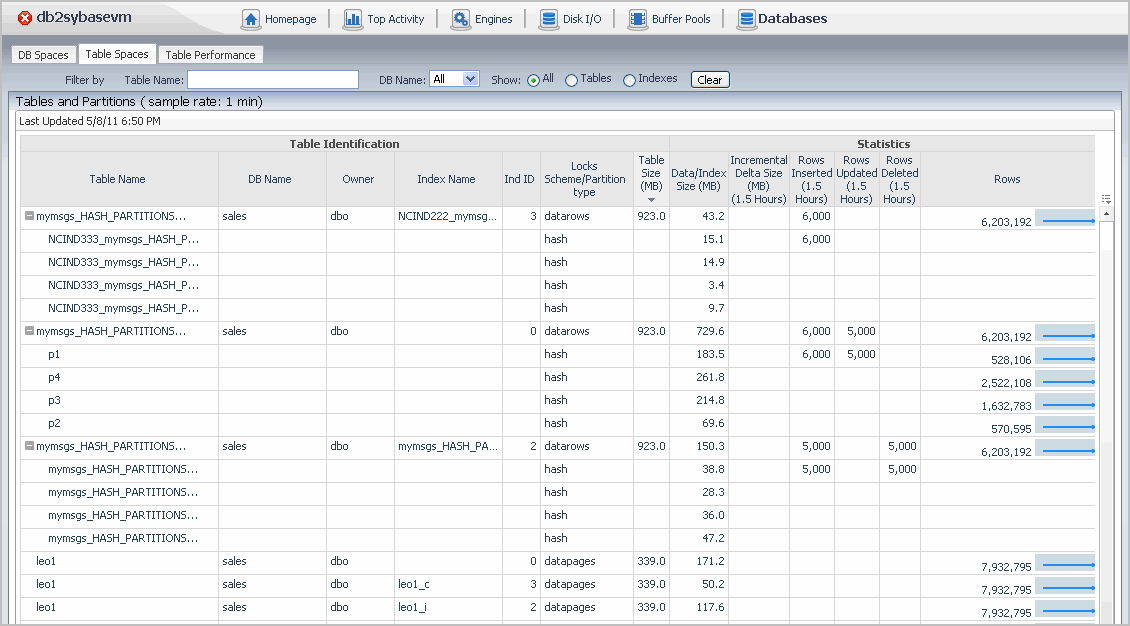
The Table Spaces information is provided in a table.

To enable the data collection for a database and to display this data on the Table Spaces tab, the database must be added to the Table Space Monitoring list in the Table Space Management group of the Sybase_MDA Agent properties. For more information, see Setting Table Space Management Properties.

Figure 31. Table Spaces Tab

Table Spaces Filters

The filters appearing just above the table allows you to look for specific entry based on some known criteria. You can filter on table and/or database name, and choose between showing the table and/or indices.

Table Spaces Table

Table 50. Table Space Table Description

Name

Description

Last Updated

Table Identification

Table Name

For table entries, this column contains the table name. If the table has one or more partition, the table name can be expanded to show the names of table partitions in this column.

For index entries, this column contains the name of the table associated with the index.

When the row shows information about a table, clicking this column shows additional information in the Table Usage Drilldown. For index entries, clicking this column shows the Index Usage Drilldown. Clicking a partition the Partition-Table Usage Drilldown.

DB Name

The name of the database to which the table belongs.

Owner

The table owner.

Index Name

The name of the table index.

Ind ID

For index entries, this column contains the ID of the table index. For table entries, this column shows zero ‘0’. For partitions, this column is blank.

Locks Schema/Partition type

For table entries, this column indicates its locking schema: allpages, datapages, or datarows.

For partition entries, this column indicates its type: range, hash, list, or roundrobin.

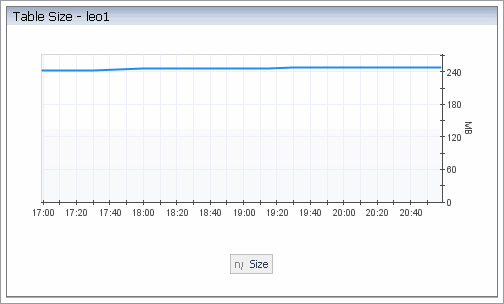
Table Size (MB)

The table size in MB, including the amount of space occupied by the table data and index.

Clicking or hovering over this column shows a chart indicating the table size over time.

Statistics

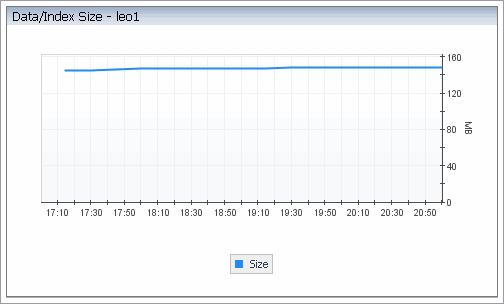
Data/Index Size (MB)

For index entries, this column shows the amount of space occupied by the table index.

For table entries, this column shows the amount of space occupied by the table data.

Clicking or hovering over this column shows a chart indicating the displayed data or index size over time.

Incremental Delta Size (MB) (1.5 Hours)

The difference in size of the table data and index over the past one and a half hour.

Rows Inserted (1.5 Hours)

The number of rows inserted over the last one and a half hour.

Rows Updated (1.5 Hours)

The number of rows updated over the past one and a half hour.

Rows Deleted (1.5 Hours)

The number of rows deleted over the past one and a half hour.

Rows

For index entries, this column shows zero ‘0’.

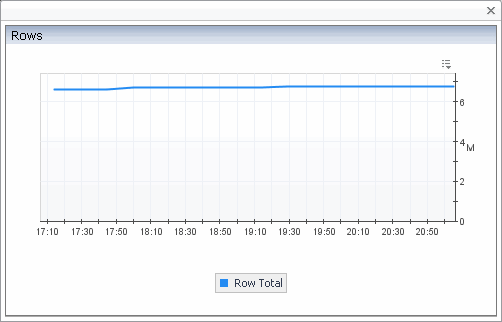
For table entries, this column shows the number of rows in the table. Clicking or hovering over this column shows a chart indicating the displayed number of table rows over time.

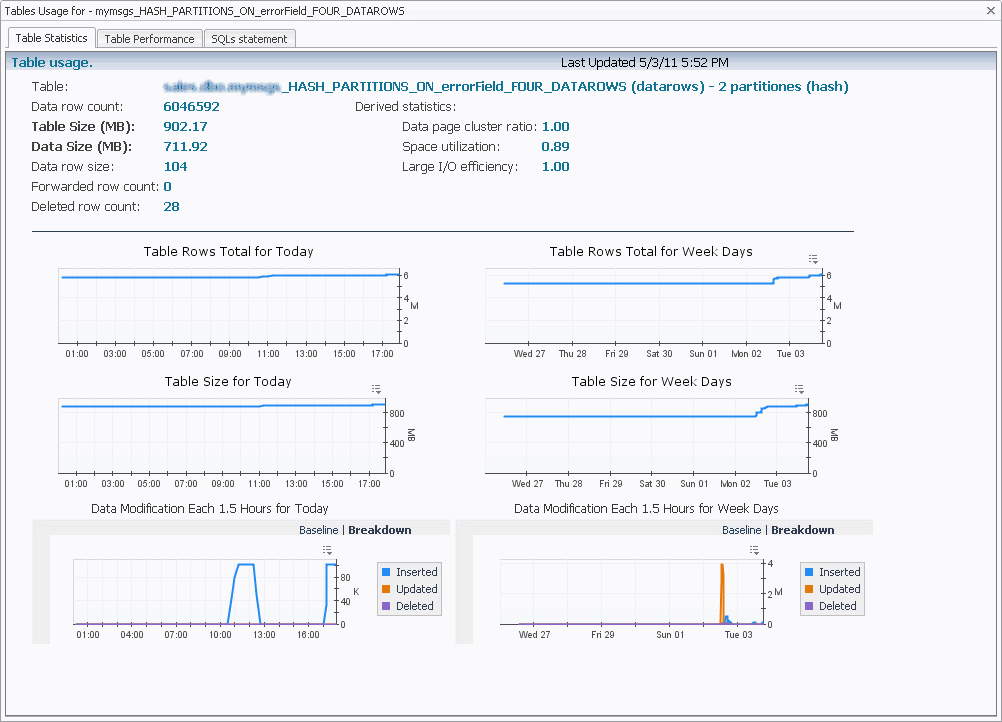
Table Usage Drilldown

The Table Usage drilldown displays a dialog box with detailed information about the selected table.

Figure 32. Table Usage Drilldown details

Table 51. Table Usage Drilldown Descriptio

Name

Description

Table

The table name, its locking schema, and the number of partitions.

Data row count

The number of data rows.

Table Size (MB)

The total table size in MB.

Data Size (MB)

The amount of table space occupied by the data.

Data row size

The data row size.

Forwarded row count

The number of rows forwarded to other pages.

Deleted row count

The number of deleted rows.

Derived statistics

NOTE: This is the same information that can be obtained with the Sybase optdiag utility. For more information about this command, see your Sybase documentation.

Charts

Table Rows Total for Today

The count of table rows, shown over the course of the current day.

Table Size for Today

The table size in MB, shown over the course of the current day.

Data Modification Each 1.5 Hours for Today

Data modification, including the amounts of inserted, updated, and deleted data, shown over the course of the current day.

Table Rows Total for Week Days

The number of table rows, shown over the course of the current week.

Table Size for Week Days

The table size in MB, shown over the course of the current week.

Data Modification Each 1.5 Hours for Week Days

Data modification, including the amounts of inserted, updated, and deleted data, shown over the course of the current week.

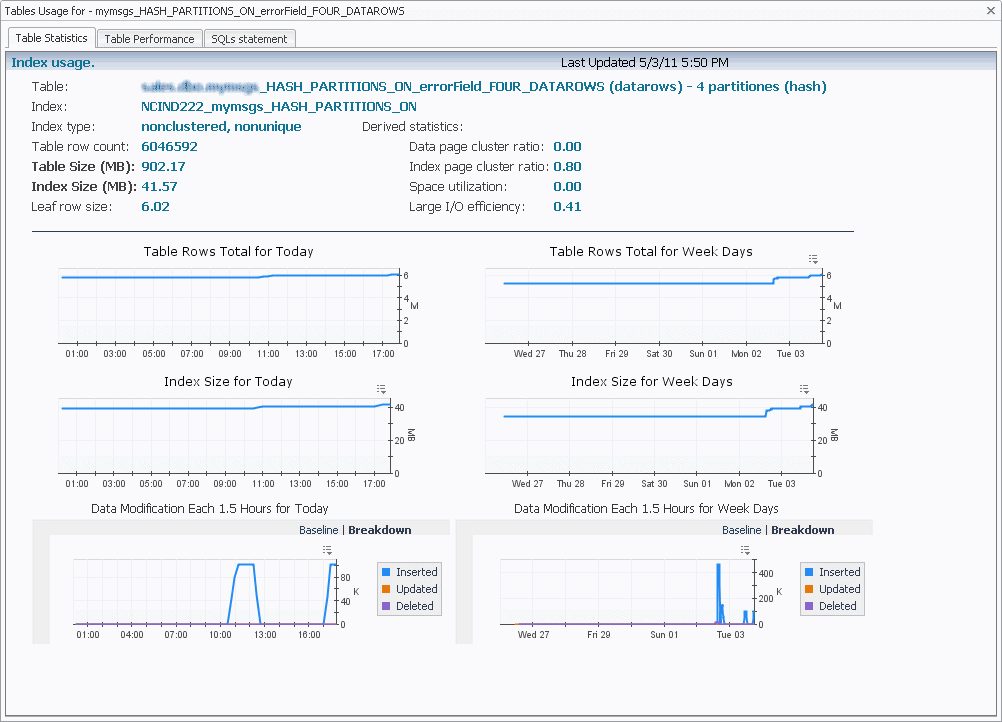
Index Usage Drilldown

The Index Usage drilldown displays a dialog box with detailed information about the selected index.

Figure 33. Index Usage Drilldown

Table 52. Index Usage Drilldown Description

Name

Description

Table

The name of the table associated with the index, the table’s locking schema, and the number of partitions.

Index

The index name.

Index type

The index type.

Table row count

The number of table rows.

Index Size (MB)

The index size in MB.

Leaf row size

The leaf row size.

Derived statistics

NOTE: This is the same information that can be obtained with the Sybase optdiag utility. For more information about this command, see your Sybase documentation.

Charts

Table Rows Total for Today

The count of table rows, shown over the course of the current day.

Index Size for Today

The index size in MB, shown over the course of the current day.

Data Modification Each 1.5 Hours for Today

Data modification, including the amounts of inserted, updated, and deleted data, shown over the course of the current day.

Table Rows Total for Week Days

The number of table rows, shown over the course of the current week.

Index Size for Week Days

The index size in MB, shown over the course of the current week.

Data Modification Each 1.5 Hours for Week Days

Data modification, including the amounts of inserted, updated, and deleted data, shown over the course of the current week.

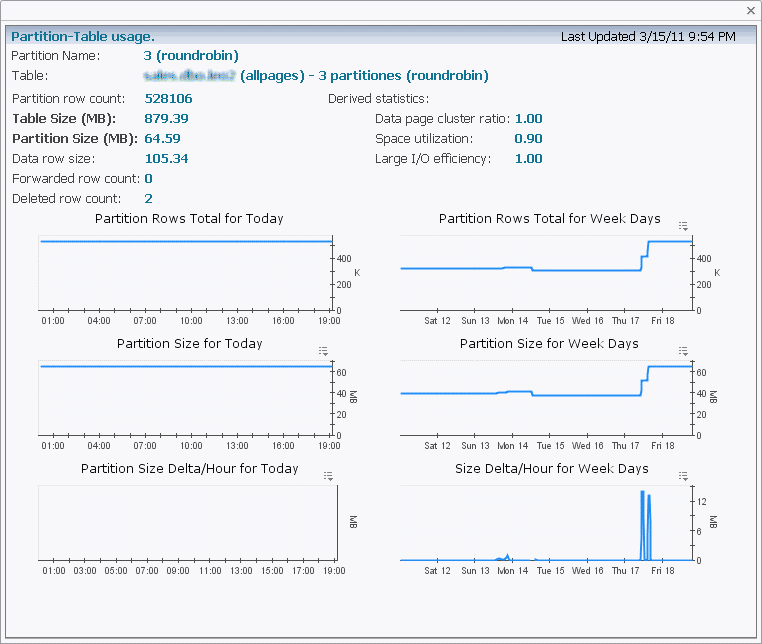
Partition-Table Usage Drilldown

The Partition-Table Usage drilldown displays a dialog box with detailed information about the selected partition.

Figure 34. Partition-Table Usage Drilldown

Table 53. Partition-Table Usage Drilldown Description
Name

Description

Partition Name

The partition name.

Table

The name of the table to which the selected partition belongs, the table’s locking schema, the number of partitions it contains and their type.

Partition row count

The number of rows in the partition.

Table Size (MB)

The table size in MB.

Partition Size (MB)

The partition size in MB.

Data row size

The data row size.

Forwarded row count

The number of rows forwarded to other pages.

Deleted row count

The number of deleted rows.

Derived statistics

NOTE: This is the same information that can be obtained with the Sybase optdiag utility. For more information about this command, see your Sybase documentation.

Charts

Partition Rows Total for Today

The count of partition rows, shown over the course of the current day.

Partition Size for Today

The partition size in MB, shown over the course of the current day.

Partition Size Delta/Hour for Today

The change in partition size in MB, shown over the course of the current day.

Partition Rows Total for Week Days

The number of partition rows, shown over the course of the current week.

Partition Size for Week Days

The partition size in MB, shown over the course of the current week.

Size Delta/Hour for Week Days

The change in partition size in MB, shown over the course of the current week.

Documents connexes

The document was helpful.

Sélectionner une évaluation

I easily found the information I needed.

Sélectionner une évaluation