Tchater maintenant avec le support
Tchattez avec un ingénieur du support

Foglight for Exchange 7.3.0 - User Guide

Navigation basics Exploring the Foglight for Exchange Dashboards Managing Exchange agents Reporting on your Exchange environment Foglight for Exchange views
Role views Exchange Server views Site views Cluster views Description of Embedded views
Agent State view Alarms view Auto Attendant Calls view Auto Attendant Directory Access view Auto Attendant General view Auto Attendant Transfers view Cached LDAP Searches/sec view CAS AB Load view CAS AB Service view CAS Control Panel Load view CAS Load view CAS OAB Download view CAS RPC Client Access view CAS RPC Client Access Load view CAS RPC HTTP view Client Access Features view Cluster Database Details view Cluster Storage Group Details view Cluster Summary and Resource Information view Cluster Summary view Clusters Listing view CPU view Disk view Domain Controllers view Edge Agent view Edge Transport Features view Exchange Roles Server Summary view Exchange Server Roles view (reference information) Exchange Servers in This Cluster view Exchange Servers view (Exchange Cluster Environment Summary) Exchange Servers view Host Monitor view Hub Transport Features view IP Address view Mailbox Features view Mailbox Store Assistant view Managed Availability Recovery Action Results view Memory view Network view Processes LDAP Read Time view Resource Utilization view Roles Listing view Roles Explorer view Role Features State view Roles Top 3 view Server Health view Server Listing view Servers in Site view Servers In This Site view Site By Category view Site Listing view Store Calendar Attendant view Store Client Search view Store Content Indexing view Store Database view Store Public Load view Store Resource Booking view Store RPC Client Throttling view Store Transport view Store User Load view Summary and Resource Information view Top 3 CPU Consumers view Top 3 Memory Consumers view Top 3 Network Consumers view Top 3 Storage Consumers view Total LDAP Read Time On All DCs view Total Long-Running LDAP Operations On All DCs view Transport Dumpster view Transport Edge Sync view Transport Extensibility Agent view Transport Load Store Drivers view Transport Queues view UM Availability view UM Call Answer General view UM Call Answer view UM Fax view UM General Current view UM General view UM Subscriber Access Calendar view UM Subscriber Access Directory view UM Subscriber Access General view UM Subscriber Access Message view Unified Messaging Features view Windows Services view
Foglight for Exchange rules Running diagnostic tests Managing Exchange metrics

Exchange Sites Environment Summary (All Sites) view

The Exchange Sites Environment Summary (All Sites) view displays a site tile for each site in your environment that is hosting one or more Exchange servers. It provides summary data about the Exchange roles being performed within each site. It also displays the number of roles in each of the alarm states (fatal, critical, and warning) for each site.

1
From the Foglight navigation panel, select Dashboards > Exchange > Exchange Environment.

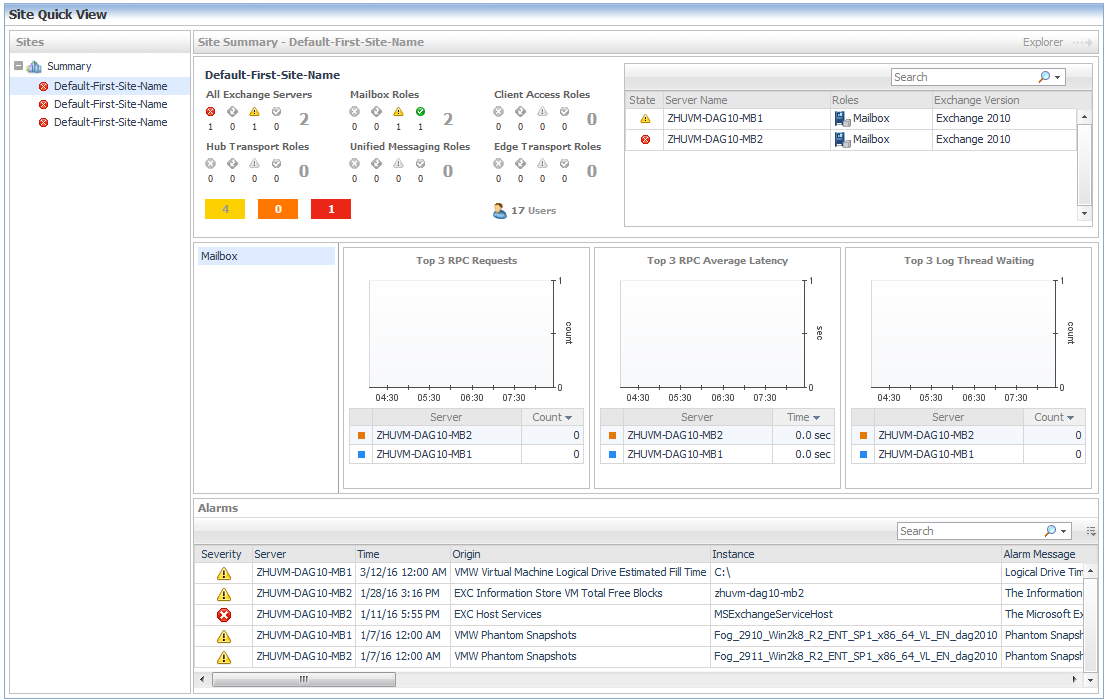
The following embedded views are displayed:

Exchange Site Environment Summary view

The Exchange Site Environment Summary view displays information about the selected site, lists the Exchange roles being performed in the selected site, and displays more detailed environment information about the Exchange servers in the selected site.

1
From the Foglight navigation panel, select Dashboards > Exchange > Exchange Environment.

The following embedded views are displayed:

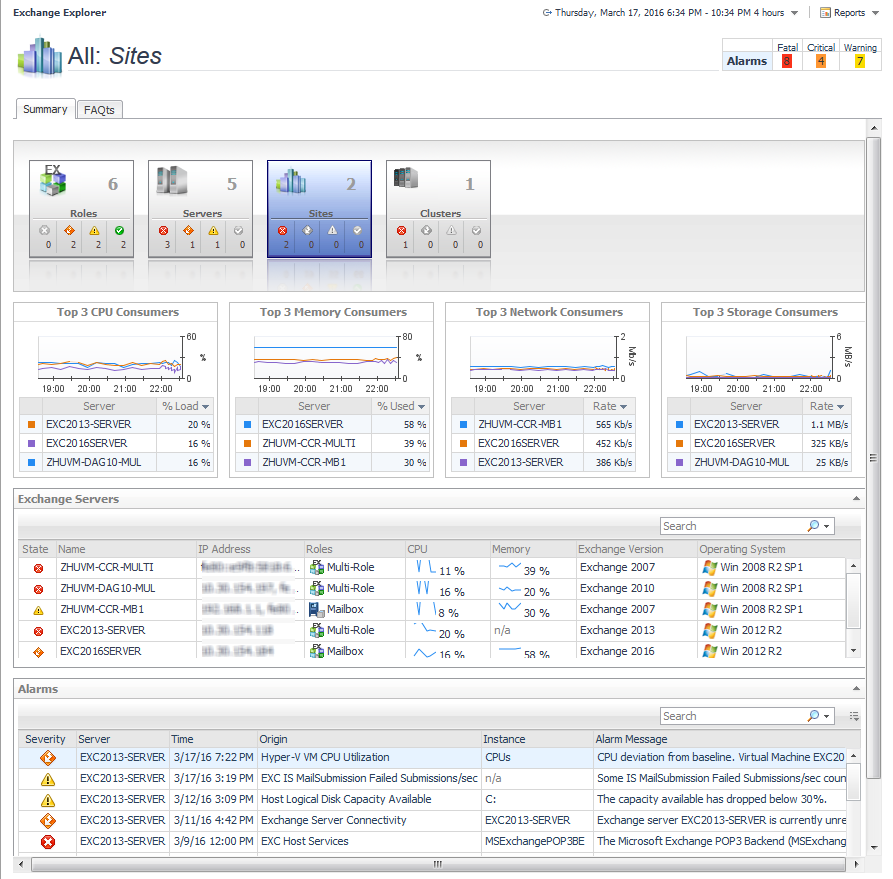
Exchange Sites Explorer Summary (All Sites) view

The Exchange Sites Explorer Summary (All Sites) view displays detailed resource metrics and information about the Exchange servers in all monitored sites in our Exchange environment.

1
From the Foglight navigation panel, select Dashboards > Exchange > Exchange Explorer.

The following embedded views are displayed:

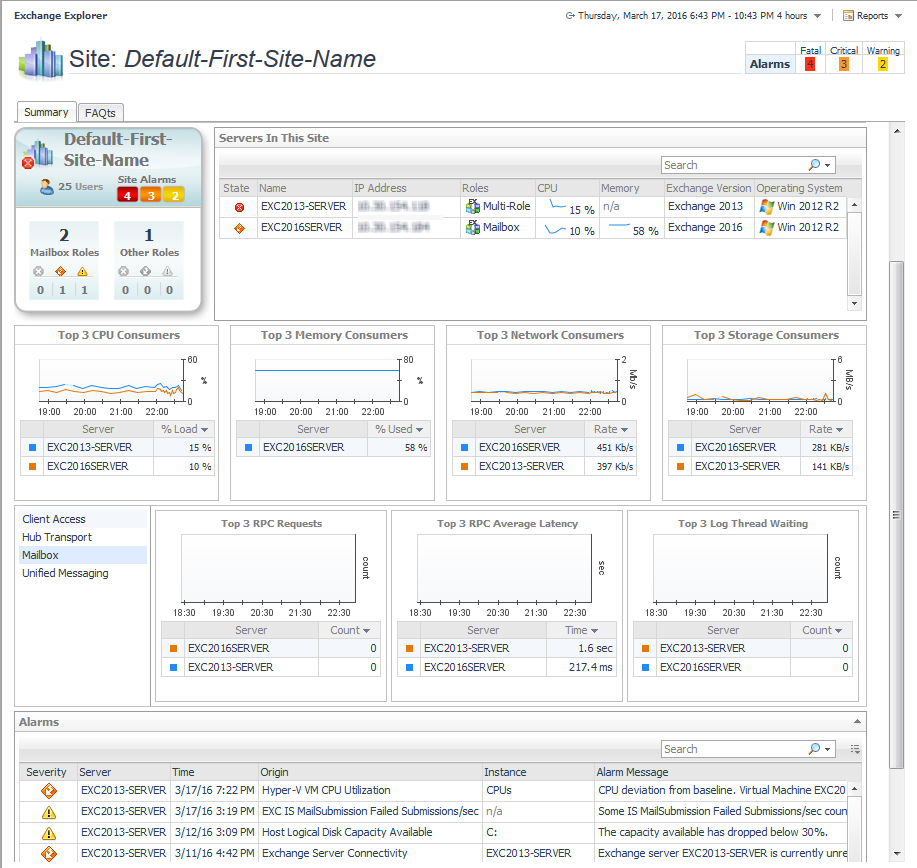
Exchange Site Explorer Summary view

The Exchange Site Explorer Summary view displays more detailed resource metrics and information about the Exchange servers in the selected site.

1
From the Foglight navigation panel, select Dashboards > Exchange > Exchange Explorer.
3
Select the Summary navigation tab.
NOTE: You can also click the Explorer link on that site’s Exchange Site Environment Summary view to display this view.

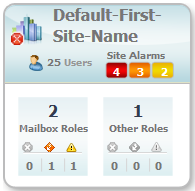
The Exchange Site Explorer Summary view displays a site tile for the selected Exchange site.

Figure 43. Site tile

A site tile displays the following information:

In addition to the site tile, this view is made up of the following embedded views:

Documents connexes
Showing 1 to 3 of 3 rows

The document was helpful.

Sélectionner une évaluation

I easily found the information I needed.

Sélectionner une évaluation