The Realtime Statistics tab in the Results page provides you with real-time graphs and raw data. This data allows you to spot system-under-test issues that may be affecting server performance. The Realtime Statistics tab displays real-time counter data. Right-clicking inside the graph displays a drop-down that allows you to change graph settings and view.
To view Real-time Statistics
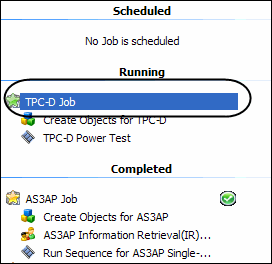
In the Jobs View, click the job running.
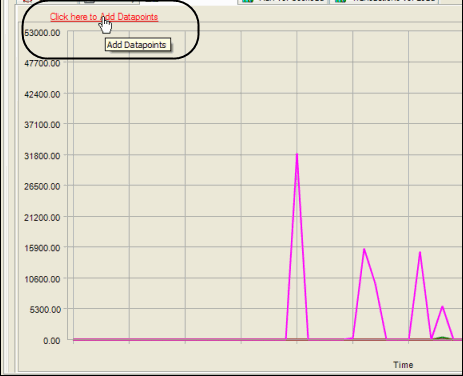
Select Click here to Add Data points. The Add Data points dialog displays.
Select the desired data points to view.
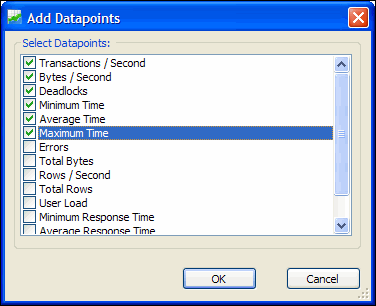
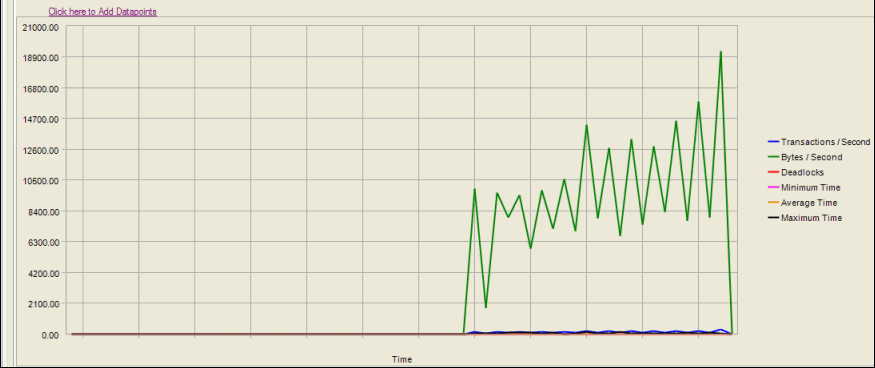
Click OK. The graph displays with the selected data points. (To change graph views, right-click. See Change Graph Views for more information.)
The Run vs. Userload tab in the Results page compares the user load transaction against the selected data point allowing you to view how the various data points are being affected by the job running.
To view Run Vs. Userload tab testing results:

The graph updates with the selected data point.
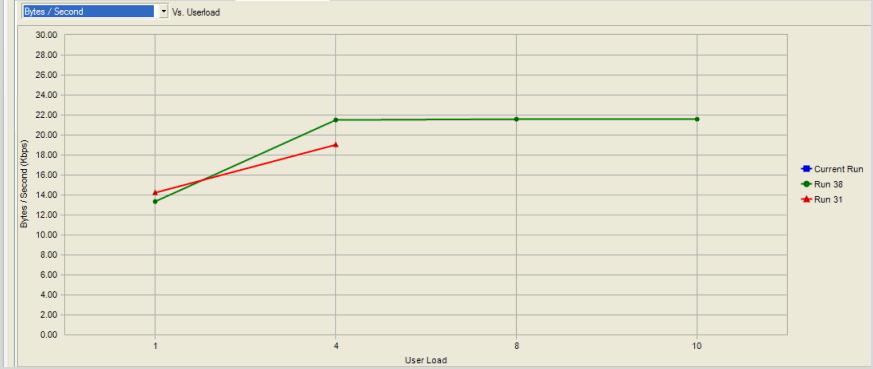
The Transactions vs Load tab in the Results page displays user selected transactions statistics for the job timing period following completion of an iteration.
To view the Real-time statistics
In the Jobs View, click the job that is currently running.

From the data points Vs. Userload drop-down list, select the data points to view.

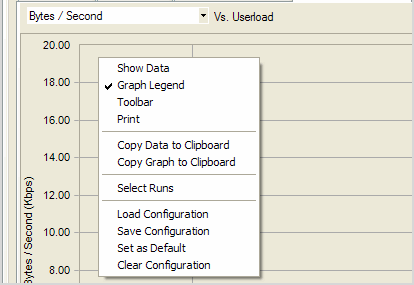
To modify a graph view, right-click a Benchmark Factory graph to display a drop-down list that allows you to customize graph settings. Whether you are viewing a real-time graph or one in Benchmark Factory Run Reports, Benchmark Factory uses the same graphing tool. In most cases you will find that the graphs are presented in the most meaningful form (Line Graphs or Bar Graphs based on the data being presented.)
|
|
Displays Benchmark Factory Run Reports
Shows in a data form or graph form Loads a saved graph configuration |
Toggling to Graph displays the data in graph form.
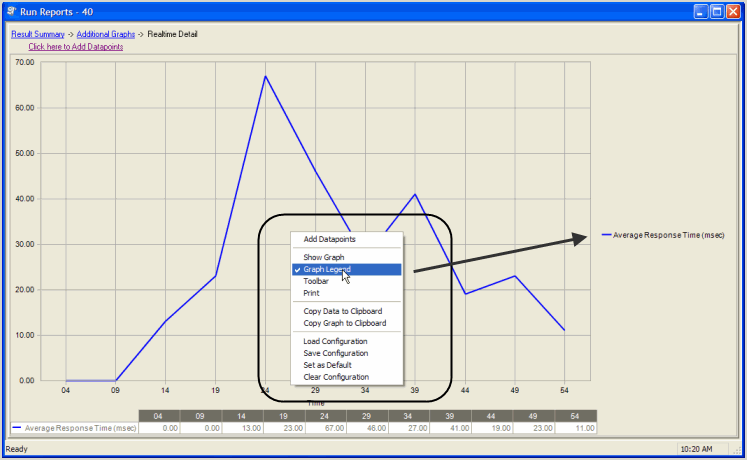
Toggling to Graph Legend displays a legend on the side of the graph.
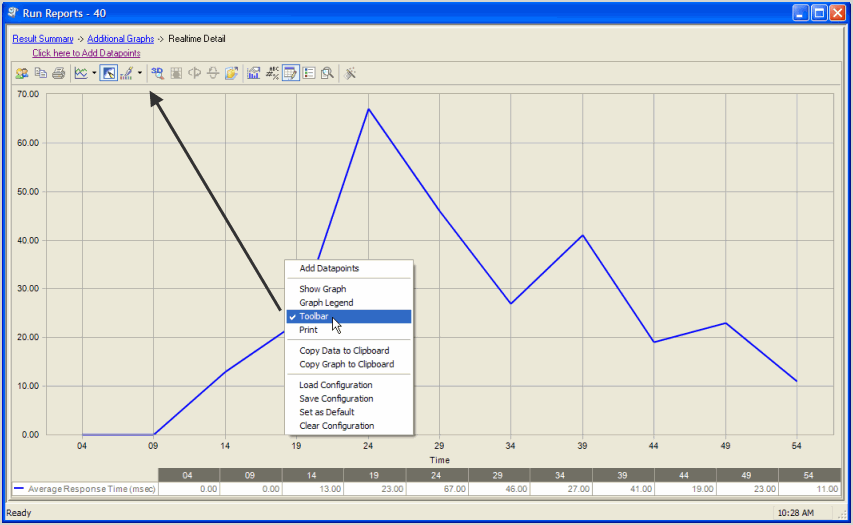
Toggling to Toolbar displays the graph toolbar.
Choosing Print displays the Print Dialog.
Copies the data to the clipboard.
Copies the graph to the clipboard.
Benchmark factories graphs allows you to save graph configurations.
Saves a graph configuration.
Sets a configured graph as default.
Clears a graph configuration.