Server monitoring
To review data collected about a specific server or all servers, make your selection in the Quick-View.
Servers view
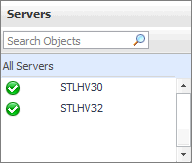
The Servers view is a tree view. It lists the servers that exist in your environment and shows their state.
This view appears in the Quick-View on the left when you select the Servers tile in the Virtual Environment view.
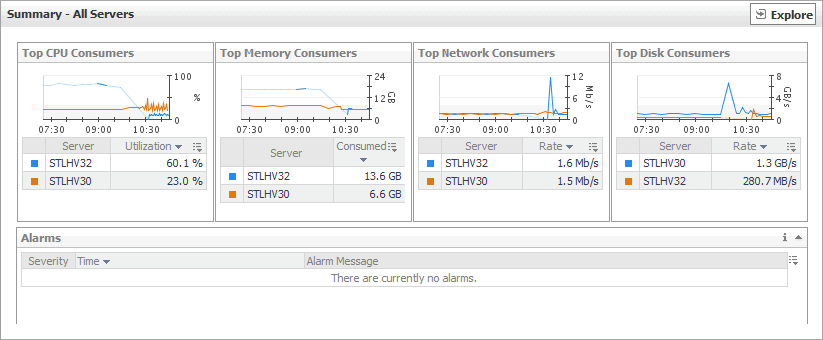
Selecting the All Servers node displays overall resource utilization for all servers in your integrated system, and the elements that consume the highest amount of system resources in the Summary - All Servers view on the right. Similarly, selecting a server node shows server-specific metrics in the Server Summary view.
| |||
| |||
| |||
| |||
|
Summary - All Servers view
The Summary - All Servers view displays overall resource utilization information for a group of physical servers and shows the elements that consume the highest amount of system resources.
This view appears in the Quick-View on the left when you select All Servers in the Servers view.
This view is made up of the following embedded views:
|
• |
| |||
| |||
| |||
| |||
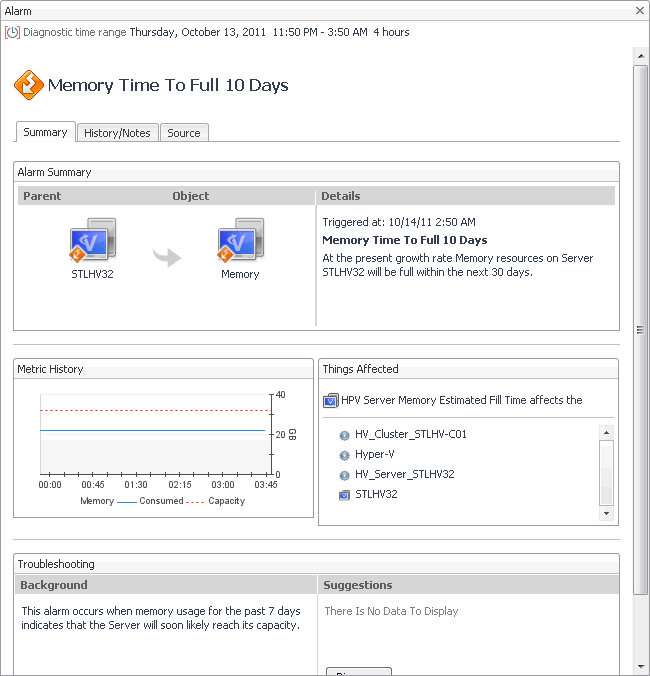
Figure 36. Alarm dialog box
| |||
|
|
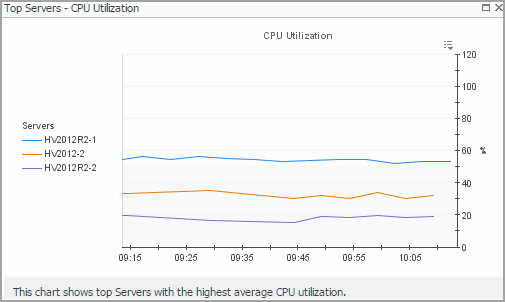
Shows the top three servers with the highest average CPU utilization. | |||
| |||
| |||
Figure 37. Top Servers - CPU Utilization dialog box
|
|
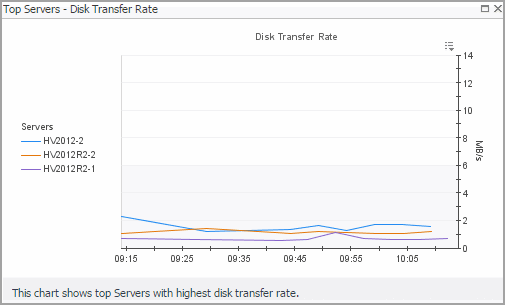
Shows the top three servers with the lowest available disk space. | |||
| |||
| |||
Figure 38. Top Servers - Disk Transfer Rate dialog box
| |||
|
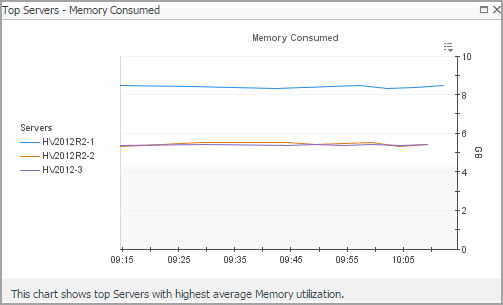
Shows the top three servers with the highest average memory utilization. | |||
| |||
| |||
Figure 39. Top Servers - Memory Consumed dialog box
| |||
|
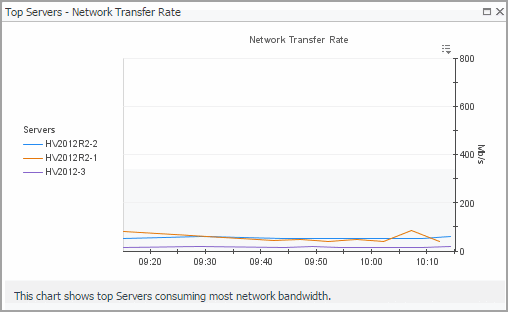
Shows the top three servers that are consuming most network bandwidth. | |||
| |||
| |||
Figure 40. Top Servers - Network Transfer Rate dialog box
| |||
|
Server Summary view
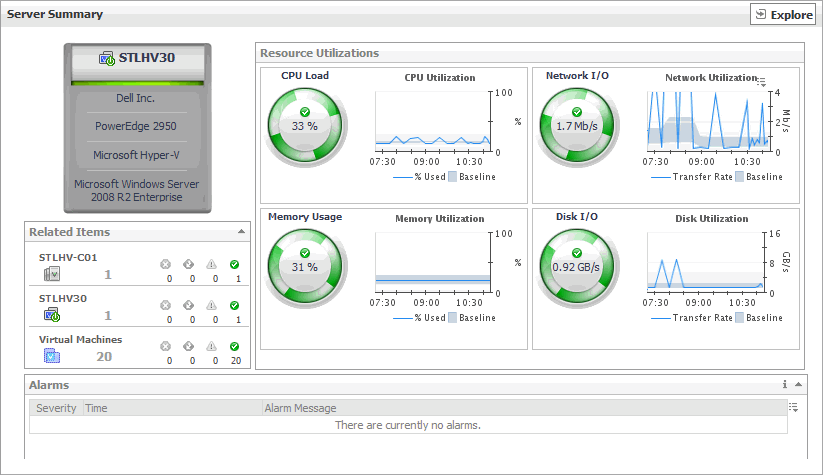
The Server Summary view shows the overall resource utilization and the amounts of system resource consumption for a physical server.
This view appears in the Quick-View on the left when you select a server in the Servers view.
This view is made up of the following embedded views:
|
• |
| |||
| |||
| |||
Figure 42. Alarm dialog box
|
| |||
| |||
| |||
Figure 43. Related objects alarm dwell
| |||
Figure 44. Clusters dwell
| |||
Figure 45. Servers dwell
| |||
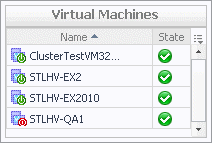
Figure 46. Virtual Machines dwell
|
|
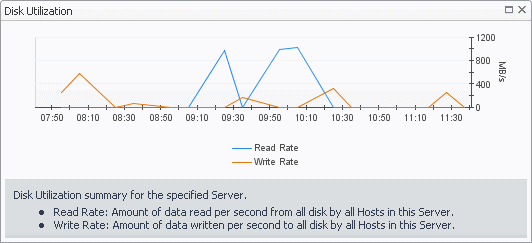
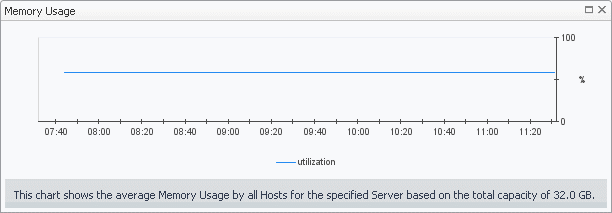
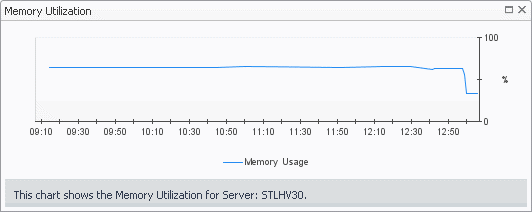
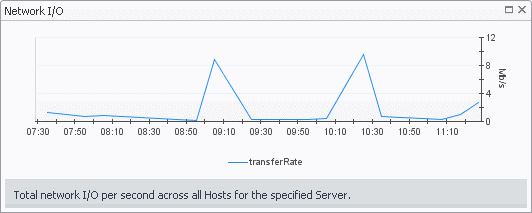
Shows the resource consumption for the selected server broken down into four simple views. | |||
| |||
| |||
| |||
| |||
| |||
| |||
| |||
| |||
| |||
| |||
| |||
| |||
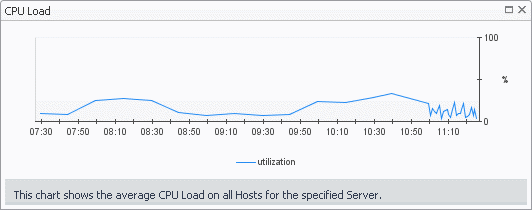
Figure 47. CPU Load dialog box
| |||
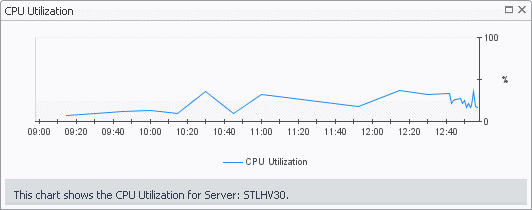
Figure 48. CPU Utilization dialog box
| |||
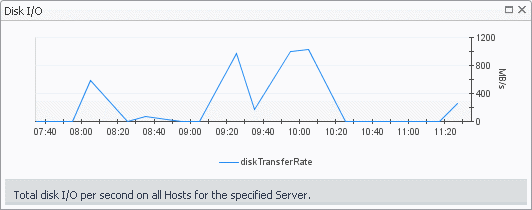
Figure 49. Disk I/O dialog box
| |||
Figure 50. Disk Utilization dialog box
| |||
Figure 51. Memory Usage dialog box
| |||
Figure 52. Memory Utilization dialog box
| |||
Figure 53. Network I/O dialog box
| |||
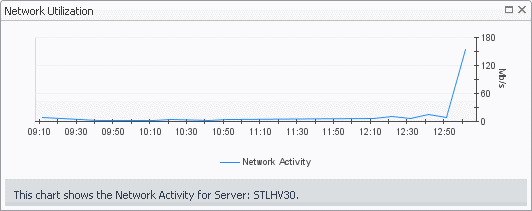
Figure 54. Network Utilization dialog box
|

