Tchater maintenant avec le support
Tchattez avec un ingénieur du support

Foglight for VMware 6.0.0 - User Guide

Using Foglight for VMware
Introducing the virtual infrastructure Navigation basics Interacting with Foglight for VMware VMware Performance Agent configuration
Reference
Views
VMware Alarms views VMware Explorer views VMware Modeler views VMware VirtualCenter views VMware Environment views Other views
Rules
Agent Rules Cluster Rules Datacenter Rules Datastore Rules Resource Pool Rules ESX Server Rules VirtualCenter Rules Virtual Machine Rules VMW Stale Data Management Rule Virtual Switch Rules
Appendix: Alarm Messages Appendix: Metrics

Monitor tab

The VMware Explorer’s Monitor tab shows details of system resources consumption for a server or a virtual machine.

Figure 67. Monitor tab

2
On the Virtual Infrastructure view, that appears on the navigation panel, select an ESX host or virtual machine instance.

This view is made up of the following embedded views:

Table 34. Cluster

Shows the details about the cluster to which the selected ESX host belongs.

Cluster. The name of the cluster to which the selected server belongs, followed by the total counts of alarms associated with the cluster, broken down by alarm types (Normal, Warning, Critical, Fatal).
CPU. The current percentage of the overall cluster’s CPU load, used to execute system code and user programs, based on the total CPU capacity.
Disk. The overall cluster’s current disk I/O rate.
ESX Hosts. The number of all ESX hosts associated with the cluster, including running and turned-off servers.
Memory. The current percentage of the cluster’s memory usage.
Network. The current rate at which the cluster transfers data from and to the network.
VMs. The number of all virtual machines associated with the cluster, including running and powered-off virtual machines.
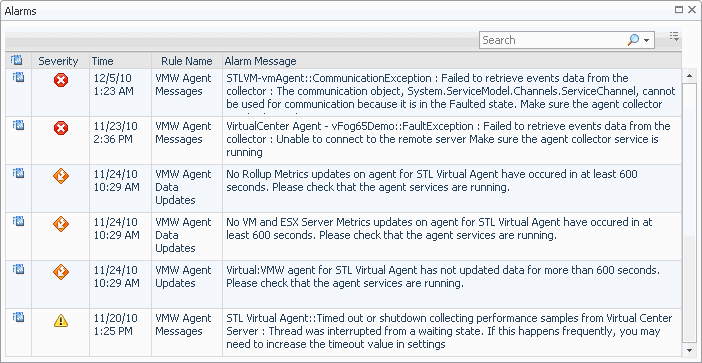
Drill down on any alarm count. Displays the Alarms dialog box that shows a list of all related alarms.
Table 35. Datacenter

Shows the details about the datacenter the selected virtual machine is associated with.

Clusters. The name of the cluster the selected datacenter is associated with.
CPU. The current percentage of the overall datacenter’s CPU load, used to execute system code and user programs, based on the total CPU capacity.
Datacenter. The name of the datacenter with which the selected virtual machine is associated, followed by the total counts of alarms associated with the datacenter, broken down by alarm types (Normal, Warning, Critical, Fatal).
Disk. The overall datacenter’s current disk I/O rate.
Hosts. The number of all hosts associated with the datacenter, including running and turned-off hosts.
Memory. The current percentage of the datacenter’s memory usage.
Network. The current rate at which the datacenter transfers data from and to the network.
VMs. The number of all virtual machines associated with the datacenter, including running and powered-off virtual machines.
Drill down on any alarm count. Displays the Alarms dialog box that shows a list of all alarms associated with the datacenter.
Table 36. ESX Host

Shows the current state of the ESX Host associated with the selected virtual machine, its current resource consumption, and indicates the number of virtual machines associated with the server.

CPU. The current percentage of the ESX host’s CPU load, used to execute system code and user programs, based on the total CPU capacity.
Disk. The ESX host’s current disk I/O rate.
Memory. The current percentage of the ESX host’s memory usage.
Virtual machines. The number of the virtual machines associated with the ESX host, followed by the counts of all alarms associated with the virtual machines, broken down by the alarm state (Normal, Warning, Critical, Fatal).
VMs Running. The number of the virtual machines associated with the ESX host that are currently running.

Drill down on:

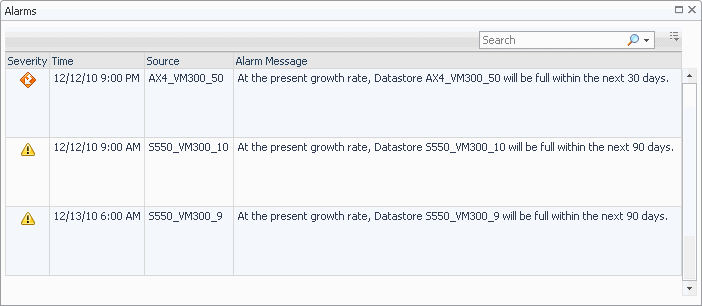
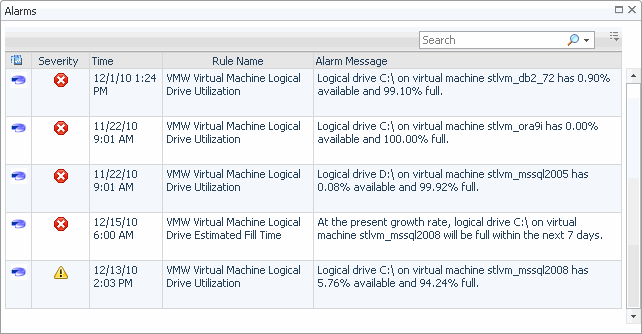
Any alarm count. Displays the Alarms dialog box that shows a list of all alarms raised against that host.
CPU. Displays the CPU Utilization dialog box.
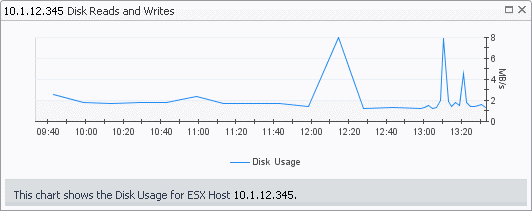
Disk. Displays the Disk Reads and Writes dialog box.
ESX Host. Displays the host details in the Summary tab.
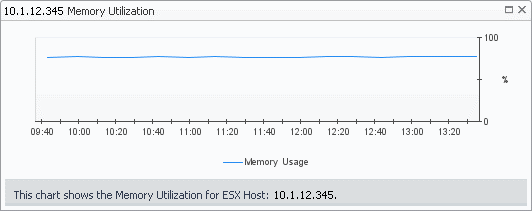
Memory. Displays the Memory Utilization dialog box.
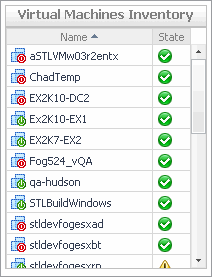
Virtual Machines. Displays the Virtual Machines Inventory dwell, showing the names and states of all virtual machines name associated with the server.

Shows the utilization of the selected ESX host’s resources.

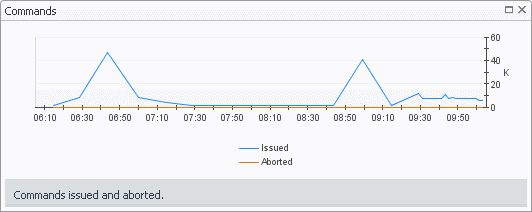
Commands, Aborted. The number of commands that are aborted during the selected time range.
Commands, Issued. The total number of commands that are issued during the selected time range.
Composite CPU Utilization. The combined CPU utilization across all CPUs on the selected ESX host.
CPU 0-N. The current percentage of each individual CPU’s load, used to execute system code and user programs, based on the total CPU capacity.
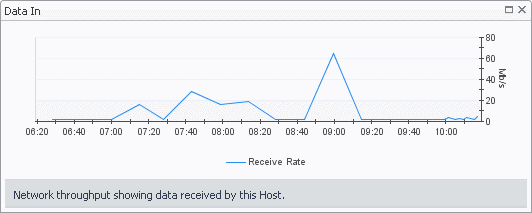
Data In. The rate at which data is received from the network during the selected time period.
Data Out. The rate at which data is transferred to the network during the selected time period.
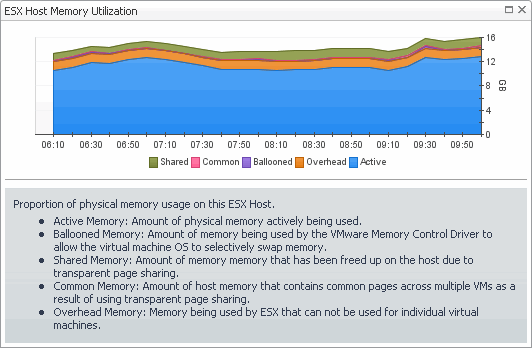
Memory Utilization, Active. The amount of physical memory that is actively being used by the host.
Memory Utilization, Ballooned. The amount of physical memory that is actively being used by the VMware Memory Control Driver to allow the guest OS to selectively swap memory.
Memory Utilization, Common: Amount of host memory that contains common pages across multiple virtual machines as a result of transparent page sharing.
Memory Utilization, Consumed. The amount of memory that is consumed by the current processes.
Memory Utilization, Granted. The amount of memory granted to the selected virtual machine.
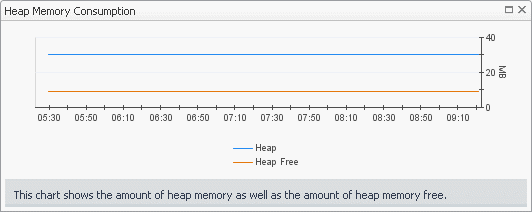
Memory Utilization, Heap Free. The amount of free heap memory.
Memory Utilization, Heap. The amount of heap memory.
Memory Utilization, Kernel. The amount of memory consumed by the kernel.
Memory Utilization, Overhead. The percentage of the server memory that is used by the current process.
Memory Utilization, Reserved. The amount of memory that is reserved by virtual machines that are running on the selected ESX host.
Memory Utilization, Shared. The amount of physical memory that is freed up due to transparent page sharing.
Memory Utilization, State. The amount of state memory.
Memory Utilization, Swap Used. The amount of memory that is stored in disk swap space.
Memory Utilization, Unreserved. The amount of memory that is not reserved by any virtual machines for the selected ESX host.
Memory Utilization, Zero Page. The amount of memory that is zero memory.
Memory Utilization. The percentage of the ESX host memory that is currently in use.
Network Summary, NIC. The name of the network interface card.
Network Summary, Receive. The current rate at which the network interface card receives data from the network.
Network Summary, Send. The current rate at which the network interface card transfers data to the network.
Network Summary, Utilization. The current rate at which the server transfers data to and from the network during the selected time period.
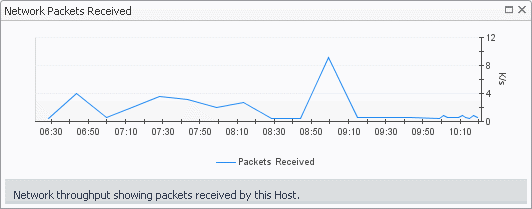
Packets In. The rate at which network packets are received during the selected time period.
Packets Out. The rate at which network packets are sent during the selected time period.
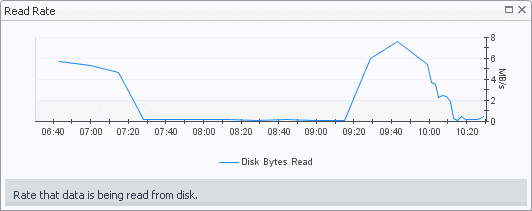
Read Rate. The rate at which data is read from the disk during the selected time period.
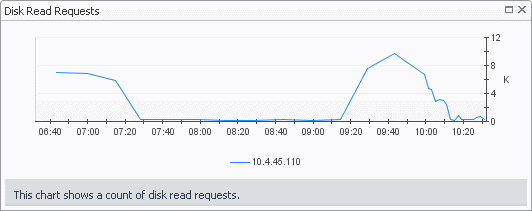
Reads. The percentage of elapsed time that the disk is busy servicing read requests during the selected time period.
Storage Summary, Disk Usage. The rate at which the server reads from or writes data to disk during the selected time period.
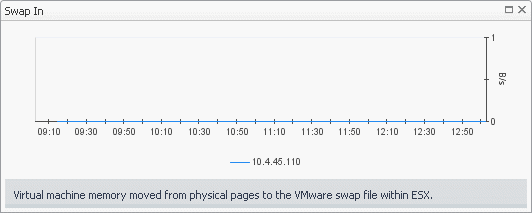
Swap In. The rate at which memory swap-ins occur.
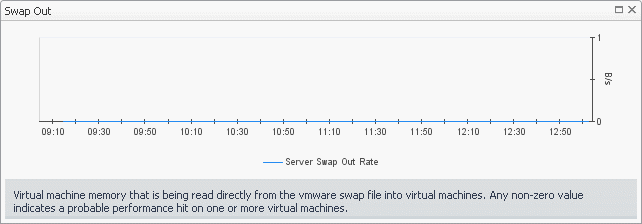
Swap Out. The rate at which memory swap-outs occur. When memory becomes scarce, the OS swaps out sleeping processes, then swaps out active processes that use large amounts of memory. If swap-outs occur, the swap space can become critically low.
Write Rate. The rate at which data is written to the disk during the selected time period.
Writes. The percentage of elapsed time that the disk is busy servicing write requests during the selected time period.

Drill down on:

Commands, Issued or Aborted. Displays the Commands dialog box.
Composite CPU Utilization. Displays the Composite CPU Utilization dialog box.
CPU 0-N. Displays the CPU N dialog box.
Data In. Displays the Data In dialog box.
Data Out. Displays the Data Out dialog box.
Memory Utilization: Active, Ballooned, Common, or Overhead, Shared. Displays the ESX Host Memory Utilization dialog box.
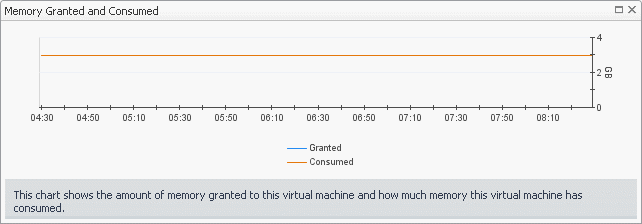
Memory Utilization: Granted or Consumed. Displays the Memory Granted and Consumed dialog box.
Memory Utilization: Heap or Heap Free. Displays the Heap Memory Consumption dialog box.
Memory Utilization: Kernel. Displays the Kernel Memory dialog box.
Memory Utilization: Reserved. Displays the Reserved Memory dialog box.
Memory Utilization: State. Displays the State Memory dialog box.
Memory Utilization: Swap Used. Displays the Swap File Used dialog box.
Memory Utilization: Unreserved. Displays the Unreserved Memory dialog box.
Memory Utilization: Zero Page. Displays the Zero Page Memory dialog box.
Memory Utilization. Displays the Host Memory Utilization dialog box.
Network Summary Utilization. Displays the Network Summary dialog box.
NIC (any entry). Displays the NIC Statistics dialog box.
Read Rate. Displays the Read Rate dialog box.
Reads. Displays the Disk Read Requests dialog box.
Storage Summary, Disk Usage. Displays the Storage Summary dialog box.
Packets In. Displays the Network Packets Received dialog box.
Packets Out. Displays the Network Packets Sent dialog box.
Swap In. Displays the Swap In dialog box.
Swap Out. Displays the Swap Out dialog box.
Write Rate. Displays the Write Rate dialog box.
Table 38. Resource Pool

Shows the details about the resource the selected virtual machine is associated with.

CPU. The current percentage of the overall datacenter’s CPU load, used to execute system code and user programs, based on the total CPU capacity.
Disk. The overall datacenter’s current disk I/O rate.
Memory. The current percentage of the datacenter’s memory usage.
Network. The current rate at which the datacenter transfers data from and to the network.
Resource Pool. The name of the resource pool with which the selected virtual machine is associated, followed by the total counts of alarms associated with the resource pool, broken down by alarm types (Normal, Warning, Critical, Fatal).
VMs. The number of all virtual machines associated with the datacenter, including running and powered-off virtual machines.
Drill down on any alarm count. Displays the Alarms dialog box that shows a list of all alarms associated with the resource pool.

Shows a list of virtual machines associated with the selected server.

Running. The number of the virtual machines, associated with the selected ESX host, that are currently running.
Virtual Machine. For each virtual machine there is an entry showing the name of the virtual machine followed by the total counts of alarms associated with the virtual machine, broken down by alarm types (Normal, Warning, Critical, Fatal).
Virtual machines. The number of the virtual machines associated with the server, followed by the counts of all alarms associated with the virtual machines, broken down by the alarm state (Normal, Warning, Critical, Fatal).

Drill down on:

Any alarm count. Displays the Alarms dialog box that shows the related alarms.
Virtual Machine. Displays the virtual machine details on the Summary tab.
Virtual Machines. Displays the Virtual Machines Inventory dwell, showing the names and states of all virtual machines name associated with the ESX host.

Shows a list messages associated with the selected virtual machine.

Message. The message content.
Time. The time at which the message is created.

Shows the utilization of the selected virtual machine’s resources.

Commands, Aborted. The number of commands that are aborted during the selected time range.
Commands, Issued. The total number of commands that are issued during the selected time range.
Composite CPU Utilization. The combined CPU utilization across all CPUs on the selected virtual machine.
CPU 0-N. The current percentage of each individual CPU’s load, used to execute system code and user programs, based on the its total CPU capacity.
Data In. The rate at which data is received from the network during the selected time period.
Data Out. The rate at which data is transferred to the network during the selected time period.
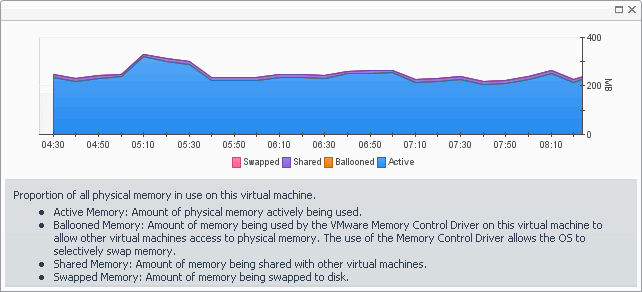
Memory Utilization, Active. The amount of physical memory that is actively being used by the virtual machine.
Memory Utilization, Balloon Actual. The amount of memory that is used by the VMware Memory Control Driver to allow the guest OS to selectively swap memory.
Memory Utilization, Balloon Target. The amount of memory set as the balloon target.
Memory Utilization, Ballooned. The amount of physical memory that is actively being used by the VMware Memory Control Driver to allow the guest OS to selectively swap memory.
Memory Utilization, Common: Amount of virtual machine memory that contains common pages across multiple virtual machines as a result of transparent page sharing.
Memory Utilization, Consumed. The amount of memory that is consumed by the current processes.
Memory Utilization, Granted. The amount of memory granted to the selected virtual machine.
Memory Utilization, Overhead. The percentage of the virtual machine memory that is used by the current process.
Memory Utilization, Shared. The amount of the virtual machine memory that is freed up due to transparent page sharing.
Memory Utilization, Swap Target. The amount of memory set as the swap target.
Memory Utilization, Swap Used. The amount of memory that is stored in disk swap space
Memory Utilization, Zero Page. The amount of memory that is zero memory.
Memory Utilization. The percentage of the virtual machine memory that is currently in use.
Network Summary, NIC. The name of a network interface card used by the selected virtual machine.
Network Summary, Receive. The current rate at which a network interface card receives data from the network.
Network Summary, Send. The current rate at which a network interface card transfers data to the network.
Network Summary, Utilization. The current rate at which the virtual machine transfers data to and from the network during the selected time period.
Packets In. The rate at which network packets are received during the selected time period.
Packets Out. The rate at which network packets are sent during the selected time period.
Read Rate. The rate at which data is read from the disk during the selected time period.
Reads. The percentage of elapsed time that the disk is busy servicing read requests during the selected time period.
Storage Summary, Disk Usage. The rate at which the server reads from or writes data to disk during the selected time period.
Swap In. The rate at which memory swap-ins occur.
Swap Out. The rate at which memory swap-outs occur. When memory becomes scarce, the OS swaps out sleeping processes, then swaps out active processes that use large amounts of memory. If swap-outs occur, the swap space can become critically low.

Drill down on:

Commands, Issued or Aborted. Displays the Commands dialog box.
Composite CPU Utilization. Displays the Composite CPU Utilization dialog box.
CPU 0-N. Displays the CPU N dialog box.
Data In. Displays the Data In dialog box.
Data Out. Displays the Data Out dialog box.
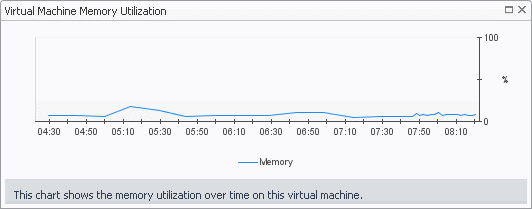
Memory Utilization: Active, Ballooned, Shared, or Swapped. Displays the Virtual Machine Memory Utilization dialog box.
Memory Utilization: Balloon Actual or Balloon Target. Displays the Target and Actual Ballooned Memory dialog box.
Memory Utilization: Granted or Consumed. Displays the Memory Granted and Consumed dialog box.
Memory Utilization: Swap Target or Swap Used. Displays the Target and Actual Swap Size dialog box.
Memory Utilization: Zero Page. Displays the Zero Page Memory dialog box.
Memory Utilization. Displays the Virtual Machine Memory Utilization dialog box.
Network Summary Utilization. Displays the Network Summary dialog box.
NIC (any entry). Displays the NIC Statistics dialog box.
Packets In. Displays the Network Packets Received dialog box.
Packets Out. Displays the Network Packets Sent dialog box.
Read Rate. Displays the Read Rate dialog box.
Reads. Displays the Disk Read Requests dialog box.
Storage Summary, Disk Usage. Displays the Storage Summary dialog box.
Swap In. Displays the Swap In dialog box.
Swap Out. Displays the Swap Out dialog box.
Write Rate. Displays the Write Rate dialog box.
Writes. Displays the Disk Write Requests dialog box.

Network tab

This tab displays the utilization of the virtual switches associated with the selected ESX hosts.

Figure 68. Network tab

2
On the Virtual Infrastructure view, that appears on the navigation panel, select a ESX host.

This tab is made up of the following embedded views:

For each virtual switch associated with the selected ESX host (and listed in Performance tab, Virtual Switches Connected to ESX Host), it displays the percentage of the network resources available to the switch that are in use.

Identifies the virtual switches associated with the selected ESX host.

Name. The name of the virtual switch.
Utilization. The current percentage of the network resources available to the virtual switch that are in use.
Throughput. The rate of network traffic processed by the virtual switch.
Traffic Types. Identifies the data traffic types that are processed by the virtual switch.
Packet Loss. The average percentage of time the data packets sent to the virtual switch are not echoed back.
Active NICs. The number of active network interface cards that the virtual switch uses.

Shows detailed configuration information about the selected virtual switch.

Throughput. The rate of network traffic processed by the virtual switch.
Bandwidth. The amount of network bandwidth available to the switch.
Total Ports. The total number of ports on the virtual switch.
Available Ports. The number of available ports on the virtual switch.
Total VM Connections. The total number of virtual machines connected to the ESX host through the virtual switch.
Powered On VMs. The total number of virtual machines connected to the ESX host through the virtual switch that are currently powered on.
Managed Object Reference. Identifies the virtual switch in your monitored environment.
Version. The version number of the distributed switch component in your virtual environment.
Active NICs. The number of active network interface cards that the virtual switch uses.
Standby NICs. The number of network interface cards that the virtual switch uses, that are currently in standby mode.
Network I/O Control (standard or distributed virtual switches only). Indicates if the selected switch can use network resource pools to prioritize network traffic.
Service Policies (Cisco virtual switches only). Shows the number of service policies in use.
Traffic Shaping. Indicates if the traffic shaping policy is enabled or disabled on the selected switch. A traffic shaping policy can restrict the network bandwidth to a port or if a port is configured to temporarily allow transmission of data at higher than normal speeds. For more information about these policies, see your VMware documentation.
Traffic Types. Identifies the data traffic types that are processed by the virtual switch.

Drill down on:

Network I/O Control (standard or distributed virtual switch only). Displays a dwell showing a list of network pools the virtual switch uses and the related information.

Traffic Shaping. Displays a dwell showing a list of port groups associated with the virtual switch and the related information.

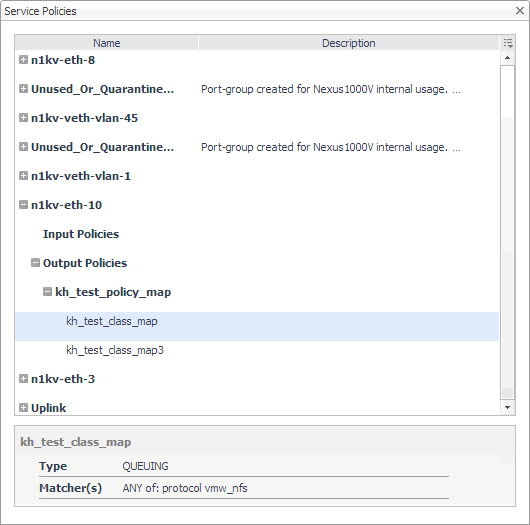
Service Policies (Cisco virtual switches only). Displays the Service Policies dialog box showing a navigation tree with port groups and the policies associated with each group. Navigate the tree and click a network policy to find out more information about it.

Displays detailed utilization information for the virtual switch selected in the Performance tab, Virtual Switches Connected to ESX Host view.

Overall tab, Virtual Switch Utilization chart. Displays the overall switch efficiency. The Packet Loss line in the chart represents the average percentage of time the data packets sent to the monitored switch are not echoed back over the selected time period. The Avg Utilization line in the chart represents the average percentage of the network resources available to the switch that are in use over the selected time period. The Avg Utilization percentage indicates the average percentage of the network resources available to the switch that are currently in use. Min / Max Spikes shows the difference between the lowest and highest percentage of the average utilization. Throughput is the rate of network traffic processed by the virtual switch.
Physical NICs tab, Physical Adapter Utilization chart. Displays the overall utilization of each network interface card used by the virtual switch.
Physical NICs tab, Physical Adapter Distribution chart. Displays the overall workload distribution for each network interface card used by the virtual switch. High/Low Utilization shows the difference between the lowest and highest percentage of the average utilization. Variance is the difference between the lowest and highest average network adapter utilization
Traffic Types tab, Traffic Type Utilization chart. Illustrates how different types of data traffic are represented in the overall network traffic managed by the selected switch. The current percentages of different type of network traffic appear in the table, while the chart displays the values captured over the selected time period.
VM Connections tab, Virtual Machine Connections chart. For each virtual machine associated with the selected virtual switch, it displays its average inbound and outbound data transfer rates over the selected time period.
Table 46. Topology tab

Visualize the relationships between the objects in your environment through an interactive map. The map illustrates how different components relate to each other, and the levels of the available resources available to them. For more information about the topology map appearing on this tab, see Standard vSwitch Topology and Distributed vSwitch Topology views

Performance tab

This tab displays the resource utilization for the selected object or group of objects over a selected period of time.

Figure 69. Performance tab

2
On the Virtual Infrastructure view, that appears on the navigation panel, select a Virtual Center, datacenter, cluster, ESX host, resource pool, or one of the following containers: Datacenters, ESX Hosts, Resource Pools, or Virtual Machines.

This tab is made up of the following embedded views:

Table 47. CPU Utilization

Shows the CPU utilization summary for the selected component based on its total capacity during a selected time period.

Ready. The percentage of time the CPU is ready but is not used.
Used. The percentage of available CPU processing that is currently in use.
Drill down on the CPU Utilization graph. Displays the graph along with some additional information.

Shows the disk utilization summary for the selected component during a selected time period.

Disk Reads. The amount of data read from disk.
Disk Writes. The amount of data written to disk.
Drill down on the Disk Utilization graph. Displays the graph along with some additional information.
Table 48. Hosts

View shows a list of all ESX hosts associated with the selected component. For each host, it shows its name, the number of CPUs, the current percentages of CPU and memory use, disk throughput rate, rate at which disk commands are issued, and the rate at which data packets are sent to and received from the network.

CPU #. The number of CPUs associated with the host.
CPU %. The current CPU utilization for the selected host.
Disk Commands Issued/Sec. The rate of disk commands issued for the selected host.
Disk Throughput. The disk throughput rate for the selected host.
Host. The host’s IP address.
Mem %. The current memory utilization for the selected host.
Net Mb/Sec. The current rate of network throughput for the selected host.
Network Packets Sent/Sec. The rate of network packets sent to the network.
Network Packets Received/Sec. The rate of network packets received from the network.
Drill down on the Disk Utilization graph. Displays the graph along with some additional information.

Shows the physical memory utilization summary for the selected component, broken into the amounts of memory that is swapped to disk, actively used, and allocated, all during a selected time period.

Active. The amount memory that is actively used.
Granted. The amount memory that is allocated to the selected component.
Swapped. The amount memory that is swapped to disk.
Drill down on the CPU Utilization graph. Displays the graph along with some additional information.

Shows the network utilization summary for the selected component, including the average rate of network throughput, and the amounts of data sent to and received from the network

Network Throughput. The average rate of network throughput.
Packets Received. The amount of data received from the network.
Packets Sent. The amount of data sent to the network.
Drill down on the Network Utilization graph. Displays the graph along with some additional information.

Processes tab

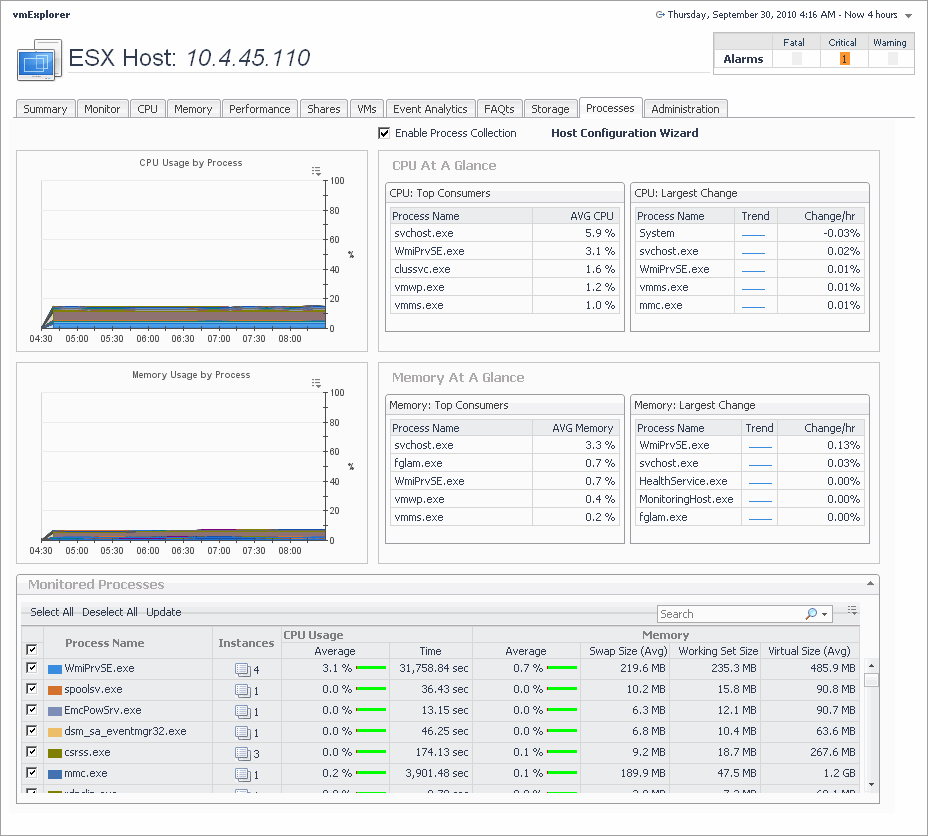
This tab only appears when you are exploring individual Virtual Centers, ESX hosts, and virtual machines, and have Foglight for Guest Processes Investigation installed and active. It displays an organized view of process information gathered by Foglight for Guest Process Investigation from the virtual or physical machine configured to send process information. When you open this tab, the process information for the selected server or virtual machine appears, allowing you to view the current CPU, memory, and monitored process statistics.

Figure 70. Processes tab

2
On the Virtual Infrastructure view, that appears on the navigation panel, select a Virtual Center, ESX host, or virtual machine instance.

This tab is made up of several embedded views. For complete information about these views, see the Investigating Guest Processes User and Reference Guide.

Documents connexes

The document was helpful.

Sélectionner une évaluation

I easily found the information I needed.

Sélectionner une évaluation