Monitoring Tab
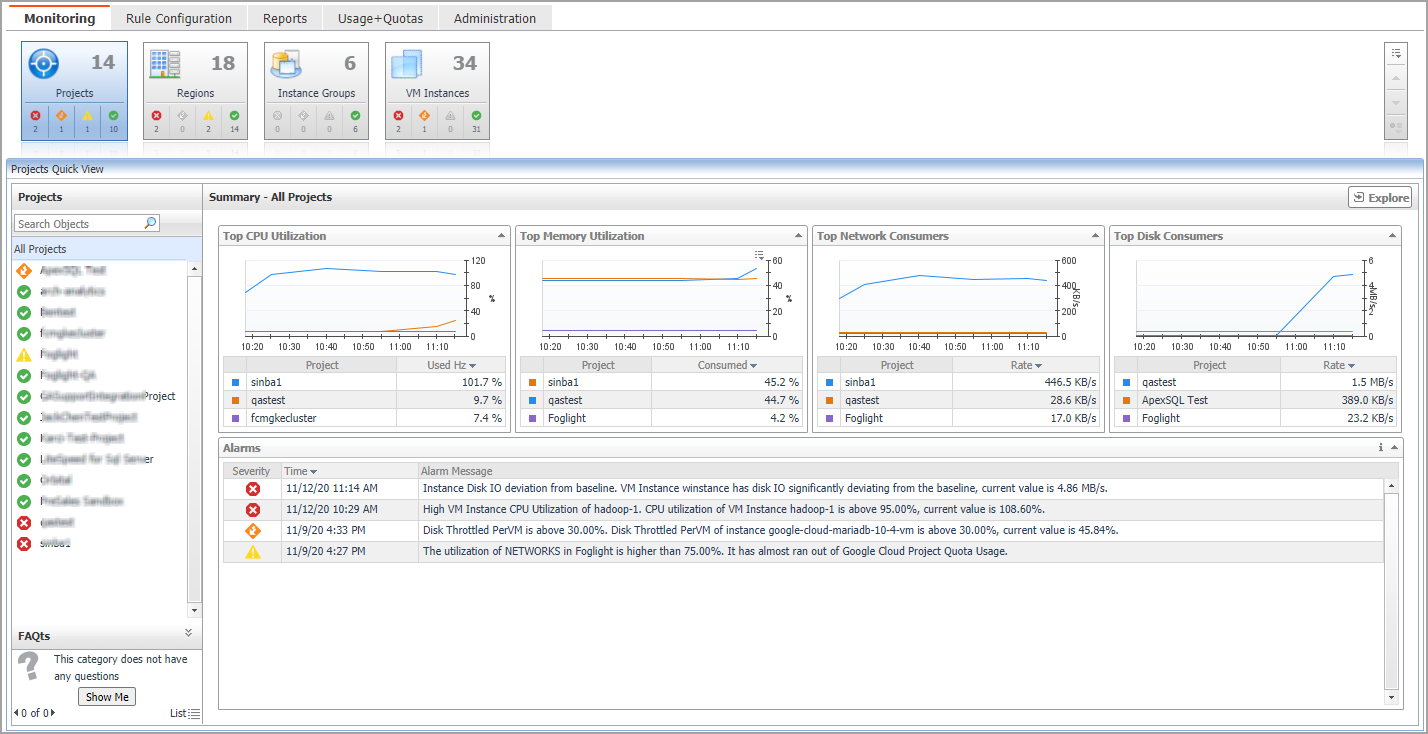
When navigating to the Cloud Manager dashboard for the first time, the Monitoring tab appears. The Monitoring tab allows you to select a monitoring object or a group of objects, such as projects, regions, instances groups, or VM instances, and review the data associated with your selection.
|
3 |
|
4 |
On the actions bar, click Monitoring. |
|
5 |
For more information, see the following topics:
|
• |
|
• |
Projects
The Projects view shows the data collected for a specific or all Google Cloud projects.
The Projects Quick View displays the following features:
|
• |
Summary - All Projects view: Shows the projects with Top CPU Utilization, Top Memory Utilization, Top Network Consumers, and Top Disk Consumers. |
|
• |
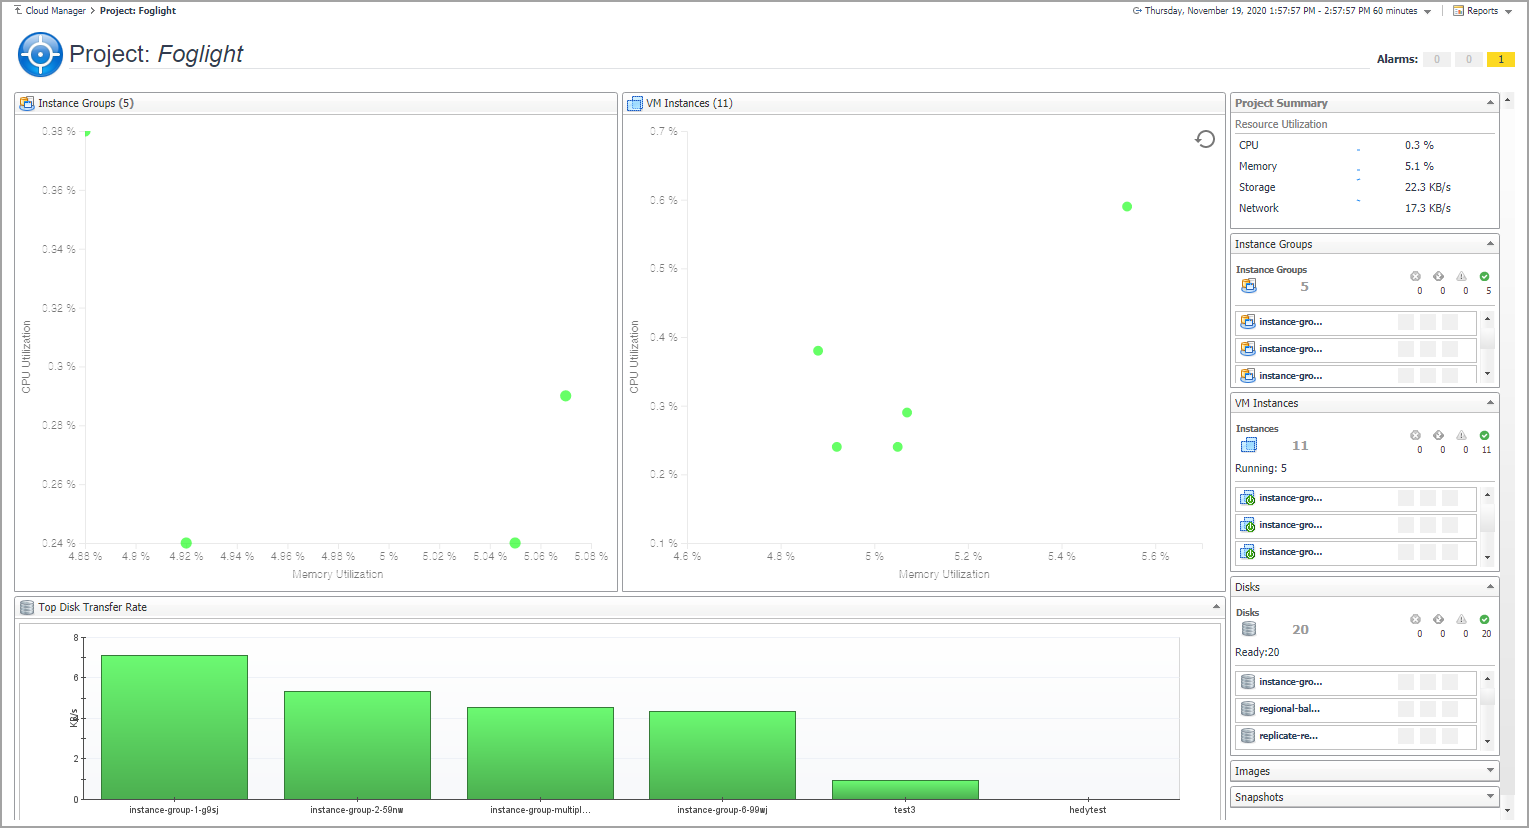
Resource Information: Shows the basic information for the selected project, including Parent, Project Number, Default Network Tier, Default Service Account, XPN Project Status, and Life Cycle State. |
|
• |
Related Items: Shows the relation and hierarchy for the selected project. |
|
• |
Resource Utilization: Shows the CPU Utilization, Network Utilization, Memory Utilization, and Disk Utilization for the selected project. |
|
• |
Alarms: Shows all the alarms related to the selected project, or all the alarms related to the projects under the selected service. |
Click Explore to open the Project Explorer view.
The Project Explorer view visually displays the detailed information of the project.
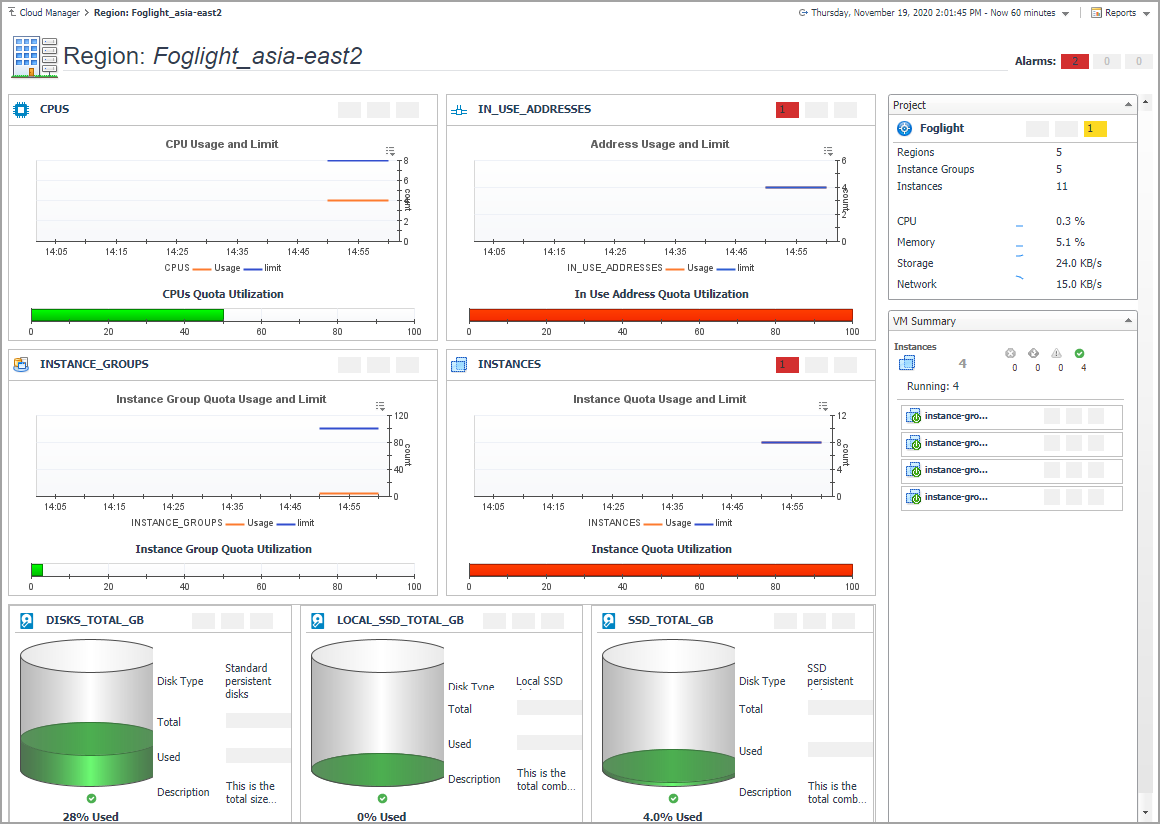
Regions
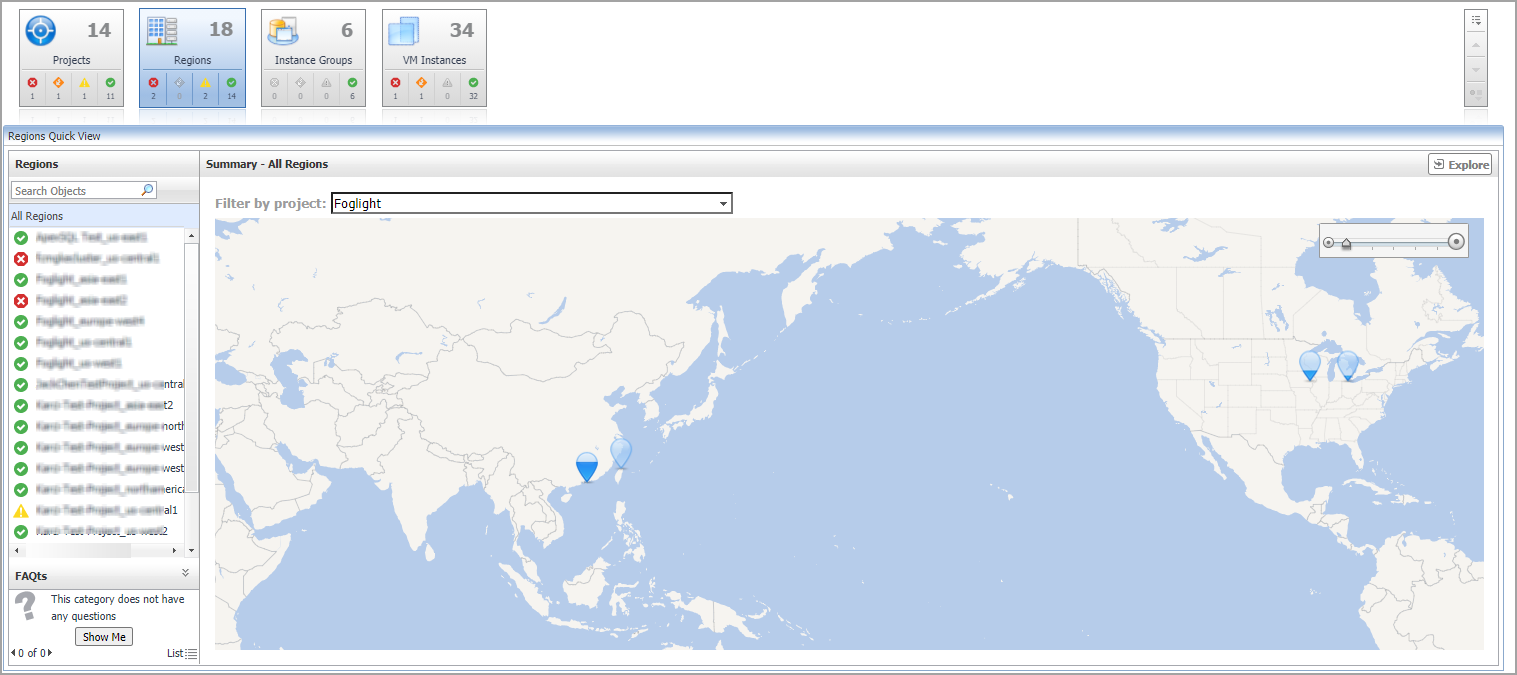
The Regions view shows the data collected about a specific region or all Google Cloud regions.
The Regions Quick View displays the following features:
|
• |
Summary - All Regions view: Choose different projects by Filter by project and view the region where the VM instances belongs to. |
|
• |
A single Region Details view |
|
• |
Related Items: Shows the relation and hierarchy for the selected region. |
|
• |
VM Instances table: Shows the Status, Name, CPU Utilization, and Memory Utilization of the VM Instances for the selected region. |
|
• |
Alarms: Shows all the alarms related to the selected region, or all the alarms related to the regions under the selected service. |
Click Explore to open the Region Explorer view.
The Region Explorer view visually displays the detailed information of the region.
Instance Groups
The Instance Groups view shows the data collected for a specific or all Google Cloud instance groups.
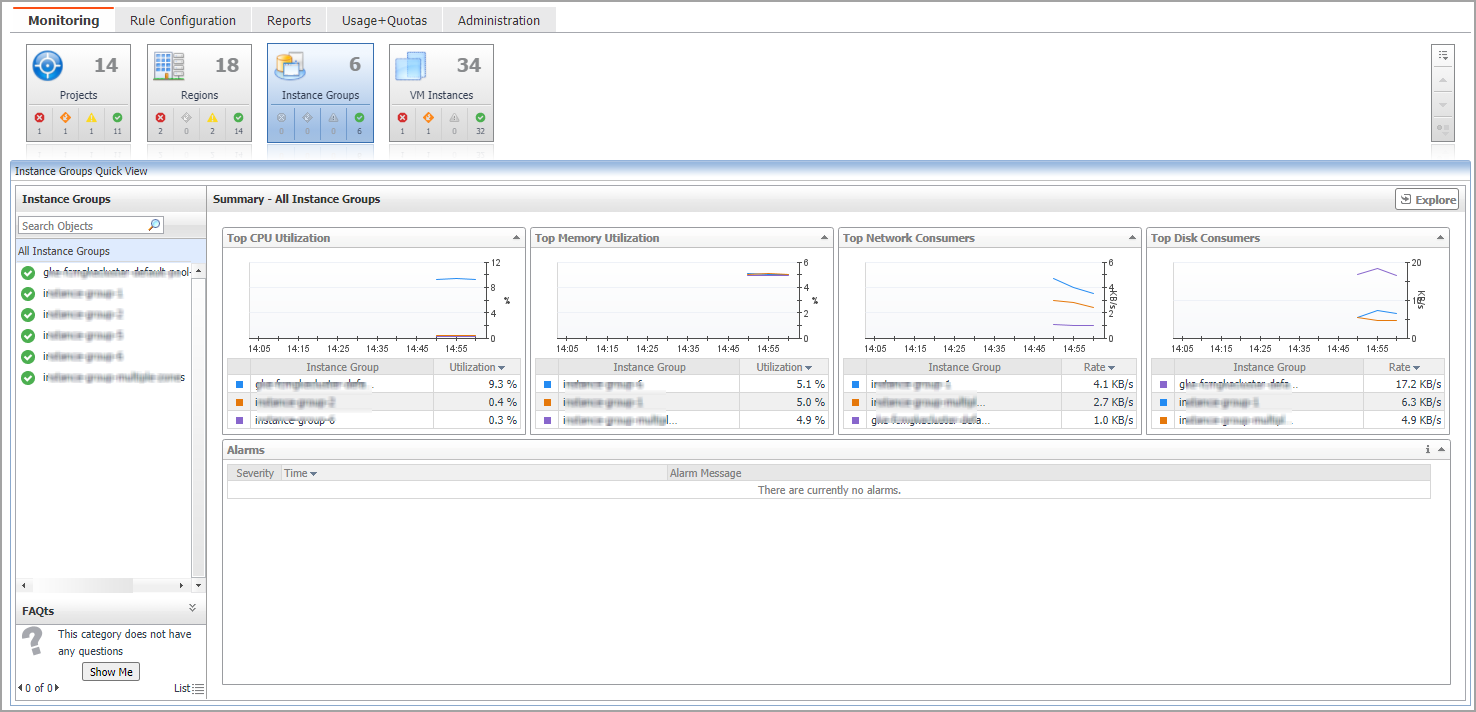
The Instance Groups Quick View displays the following features:
|
• |
Summary - All Instance Groups view: Shows the instance groups with Top CPU Utilization, Top Memory Utilization, Top Network Consumers, and Top Disk Consumers. |
|
• |
A single Instance Group Summary view |
|
• |
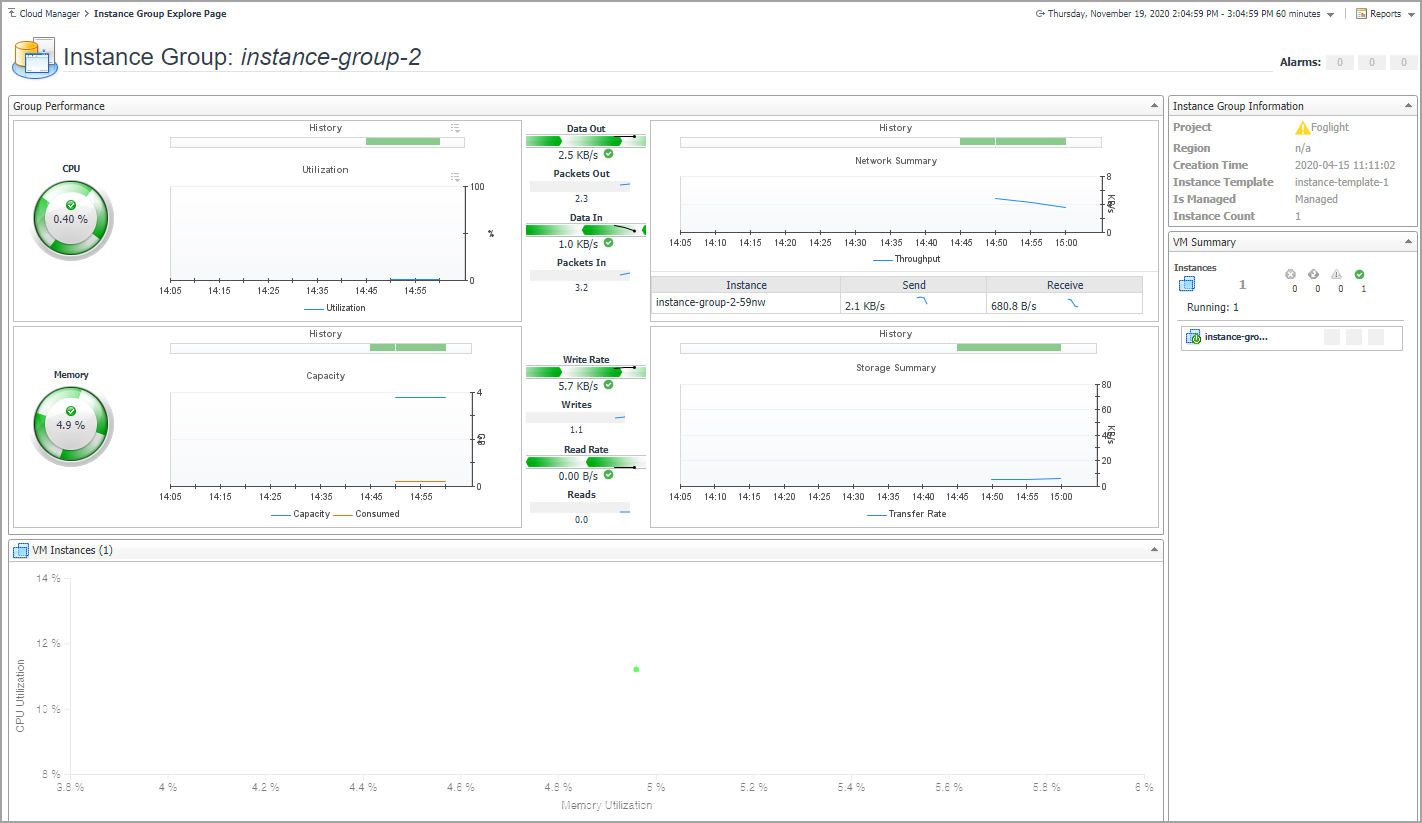
Instance Group Information: Shows the basic information for the selected instance group, including Project name, Region, Creation time, Instance Template, Is Managed, and Instance Count. |
|
• |
Related Items: Shows the relation and hierarchy for the selected instance group. |
|
• |
Resource Utilization: Shows the CPU Utilization, Network I/O, Memory Utilization, and Disk I/O for the selected instance group. |
|
• |
Alarms: Shows all the alarms related to the selected instance group, or all the alarms related to the instance groups under the selected service. |
Click Explore to open the Instance Group Explorer view.
The Instance Group Explorer view visually displays the detailed information of the instance group.