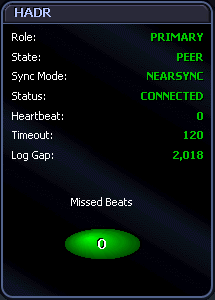
The HADR panel shows status and configuration information about databases involved in high availability disaster recovery management (HADR).
HADR is a data replication feature that ensures high availability of data. It protects against data loss in the event of a site failure by replicating data from a primary database to a standby database.
The illustration below provides an example of the information shown in the HADR panel:

Most of the information shown in the HADR panel applies only to HADR databases. The exception is role information. The information is as follows:
Role—The HADR role of a database. Standard is shown for a non-HADR database. Primary is shown for the primary HADR database. Standby is shown for the standby HADR database.
State—The current state of an HADR database:
Disconnected is shown when it is not connected to its partner database.
Local Catchup is shown when it is performing local catch-up.
Remote Catchup Pending is shown when it is waiting to connect to its partner database for remote catch-up.
Remote Catchup is shown when it is performing remote catch-up.
Peer is shown when the primary and standby databases are connected and in peer state.
Sync Mode—The current synchronization mode of an HADR database. This can be Sync, Nearsync, or Async. The mode shown is the one set when the database was last restarted.
Status—The current connection status of an HADR database:
Connected is shown when it is connected to its partner node.
Disconnected is shown when it is not connected to its partner node.
Congested is shown when a database is connected to its partner node, but one cannot send to the other.
Heartbeat—The total number of heartbeats missed on an HADR connection. To see the number of heartbeats missed since the last refresh of the Spotlight interface, check the Missed Beats component (covered below). Heartbeats are messages sent from one HADR database to another at a regular interval. They are a key indicator of the health of the connection between the databases. A value of 0 (zero) means no heartbeats have been missed and the connection is healthy. A high value indicates the condition of the connection is poor.
Timeout—The amount of time (in seconds) that the HADR database server waits for a communication attempt to succeed. A communication attempt fails when the server does not receive a reply message from its partner within this time interval. The timeout value shown is the one set when the database was last restarted.
Log Gap—The running average of any gap between the primary log sequence number (LSN) and the standby log LSN. The value is shown in bytes. A gap can occur when a log file is truncated, but LSN numbers continue without interruption for the next log file. These numbers cover a hole in log data and do not reflect the difference in data for the primary and standby logs.
Tip: Right click the Heartbeat value to see heartbeat metrics, properties, and history.
The HADR panel includes the Missed Beats component. This tracks the number of heartbeats missed on an HADR connection since the last refresh of the Spotlight interface. It lights up each time a heartbeat is missed.
Required monitor switch
None