Views
Foglight® for VMware ships with predefined views to help you monitor your application server environment. This provides quick reference information about each view.
Foglight for VMware ships with several dashboards that allow you to monitor and configure your virtual environment. Each of these dashboards contains a number of views. This section describes these views in more detail. For more information about the VMware dashboards, see Interacting with Foglight for VMware.
Foglight for VMware includes the following groups of views:
VMware Alarms views
The VMware Alarms dashboard contains the following views:
Alarms Overview
For more information about the VMware Alarms dashboard on which this view appears, see Exploring VMware alarms .
| |||
|
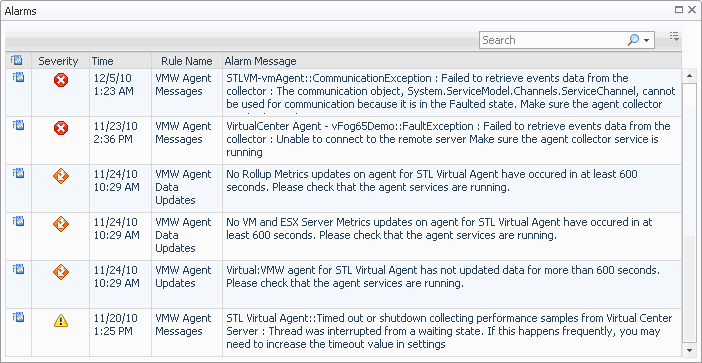
Alarms List view
For more information about managing alarms with the Foglight for VMware browser interface, see the Foglight for VMware User Guide.
| |||
| |||
| |||
| |||
| |||
From here, selecting VMware Explorer shows the selected server or virtual machine in the VMware Explorer, with the Summary tab open. Selecting Quick View shows the selected component in the Quick-View. | |||
|


