Tchater maintenant avec le support
Tchattez avec un ingénieur du support

Foglight Capacity Management 5.7.7 - User Guide

Reports

The Capacity Managment reports table provides a list of all the reports created, generated, and scheduled. In addition, you can review the history of a report and run individual reports.

Name—report name.
Date—date the report was last run.
Last run—report format the report was last run in, PDF, Excel, XML.
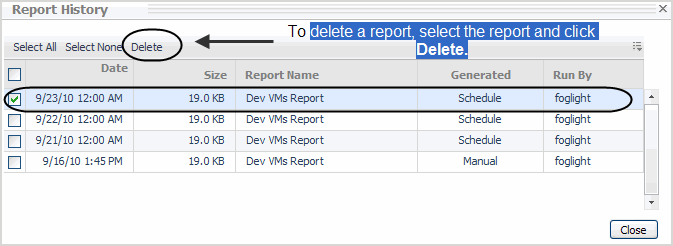
History—clicking on a report shows the Report History and the complete run history of the report. Click Delete to remove a report.
Schedule—when the report is scheduled to run.
Run Now—clicking this icon displays the Run Now tool tip and the report runs. After run completion, you can download the report for viewing.
Template—the current report template selected.

To delete scheduled reports, use the checkboxes in the Reports view to select the report. Click the Delete button at the top of the view.

Administration Tab

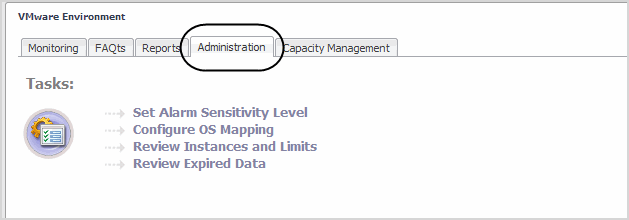
The Administration view allows you to configure the level of alarm sensitivity, operating system (OS) mapping, review instance limits, and review expired data.

For details on using the Administration view, see the Foglight™ for VMware Virtualized Environments User and Reference Guide or the Foglight for Hyper-V User and Reference Guide.

Capacity Management Tab

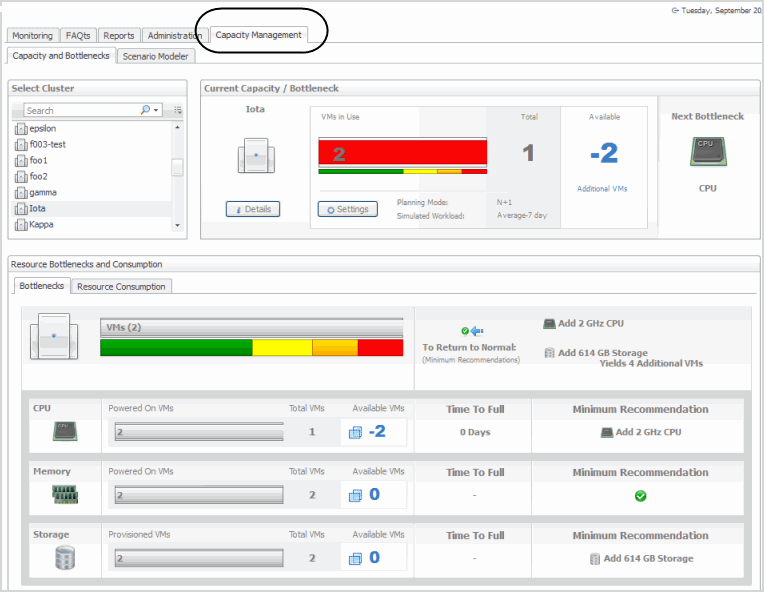
The Capacity Management view in Hyper-V Environment allows you to view detailed capacity management graphs/metrics and create capacity management scenarios. For the information about using Foglight for Capacity Director in a VMware Environment, see the Foglight for Capacity Director User Guide.

The Capacity Management view provides the following tabs:

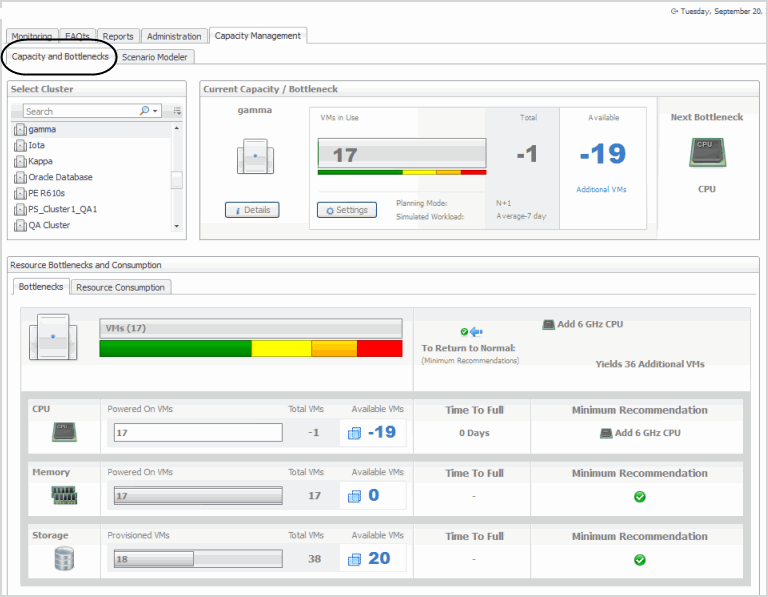
Capacity and Bottlenecks

This tab allows you to select clusters and review capacity management details of your virtual environment. You can review current capacity and the next bottleneck affecting that capacity. It also displays the order of the next capacity management resource (CPU, Memory, Storage) affecting your environment and provides minimum recommendations to avoid the reported bottleneck.

This tab displays the following sections:

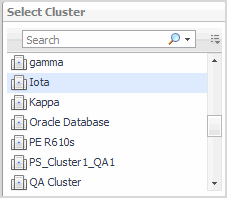
Use this view to search for and select clusters you want to view capacity management details on.

Selecting a cluster in this list populates the adjacent Current Capacity/Bottlenecks view.

This view provides a visual readout of the selected cluster based on a simulated workload (virtual machine) and the available resources.

The name of the selected cluster.

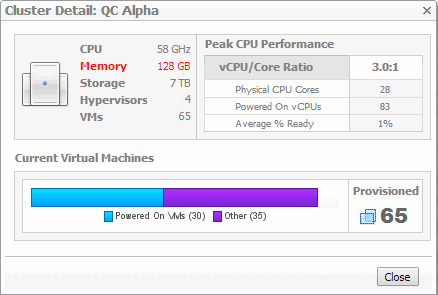
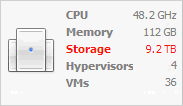
Displays the Cluster Detail dialog box, showing additional information about the selected cluster.

Figure 16. Cluster Details.

For more information, see Viewing Cluster Details.

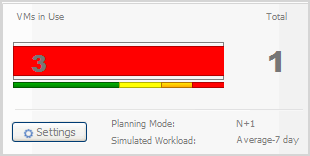
The number of virtual machines that are currently in use. The color-coded bar provides a visual reference for the capacity thresholds of the virtual machines in the selected cluster.

Figure 17. VMs in use.

Green—Normal
Yellow—Warning
Orange—Critical
Red—Fatal

The threshold values are configurable using capacity setting that span all clusters. Click Settings to display these values, and configure them, as required.

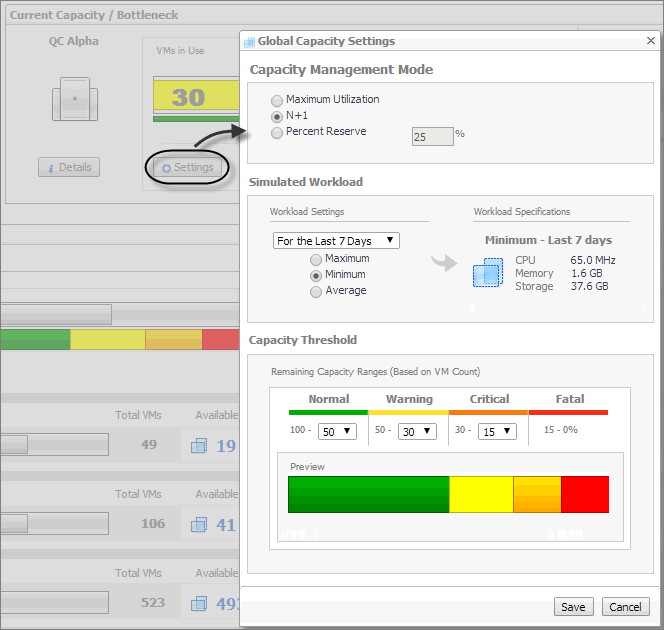
Displays the Global Capacity Settings dialog box, showing the values Foglight for Capacity Management uses to calculate the available resources.

For more information, see Configuring Global Capacity Settings.

A mode indicating how Foglight for Capacity Management determines the percentage of resources that are available for allocation. The following modes are available:

Click Settings to display these values, and configure them, as required. For more information, see Configuring Global Capacity Settings.

A combination of workload settings that are used to calculate the resources that need to be allocated to a virtual machine, based on previous resource consumption levels.

For example, you can use the average amount of resources used in the last seven days as a reference point.

Click Settings to display these values, and configure them, as required. For more information, see Configuring Global Capacity Settings.

The total number of virtual machines. This value represents the virtual machines that are currently in use plus those that are available to users, given the current global capacity settings. Click Settings to display these values, and configure them, as required. For more information, see Configuring Global Capacity Settings.

The number of virtual machines that are available for use in the cluster, and are not currently in use, based on the current Capacity Management settings. Click Settings to display these values, and configure them, as required. For more information, see Configuring Global Capacity Settings.

A visual indicator of the next anticipated bottleneck for increasing capacity on this cluster. Bottlenecks vary based on environment and workloads and may be cumulative in nature.

The Cluster Detail dialog box displays additional metrics about the selected cluster and its current configuration. To display it, in the Current Capacity/Bottleneck view, click Details.

Displays the CPU, memory, and storage resources reserved for use in the selected cluster. The value in red represents the next projected bottleneck. This view also shows the numbers of hosts and virtual machines associated with this cluster.

Allows you to examine n more detail the virtual CPU and core ratio details.

Displays the total number of provisioned virtual machines in the selected cluster. The bar represents a visual representation indicating the ratio of powered on virtual machines in the entire collection of provisioned virtual machines.

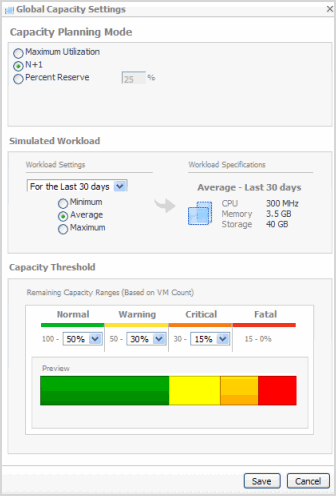
The Global Capacity Settings dialog box allows you to configure utilization, simulated workload, and capacity thresholds of a cluster. These settings apply to all clusters. To display it, in the Current Capacity/Bottleneck view, click Settings.

Allows all the available memory, CPU, and storage that is available to the cluster to be used to calculate the virtual machine capacity. No reserves are set aside and there is no redundancy.

Allows the cluster to calculate its overall virtual machine capacity, while reserving enough resources for an extra host to be used for redundancy purposes. For example, if the cluster currently contains six hosts in this mode, the capacity of the cluster is calculated using the resources for only five hosts, leaving one host for redundant failover purposes.

Allows you to set aside a custom percentage of the cluster’s total capacity. The percentage entered represents the amount to hold in reserve, with the balance being allotted to calculate total capacity. For example, entering 20% means that this percentage of the cluster’s resources is not used to calculate virtual machine capacity, and that 80% will be used to calculate the cluster’s capacity.

A simulated workload represents a typical virtual machine running on the cluster. The Simulated Workload area allows the system to capture the characteristics of a typical virtual machine used to simulate virtual machine workloads on the cluster. The simulated workload represents whatever resources that a common or typical virtual machine uses within this environment.

Specifies the timeframe over which the minimum, maximum, or average value is collected. The common setting is the last 30 days of data available.

Specify if the system should use the maximum, minimum, or average virtual machine workload found within the time range specified.

Displays the a typical set of resources needed to allocate to a virtual machine, given the supplied Workload Settings. The displayed values are used to calculate the Available VMs counts on the Bottlenecks Tab.

The amount of available capacity ranging from 100% (totally available) to whatever value is specified at the end of the normal zone.

The range of available capacity that is less than normal, but not yet critical. Its upper limit is set by the value of the Normal (green) zone.

The range of the remaining available capacity that is less than Warning, but not yet fatal. Its upper limit is set by the value of the Warning (yellow) zone.

The range of remaining available capacity that is less than critical, and continues until all capacity has been used (zero). It is set automatically based on the lower limit of the Critical (orange) zone.

This view provides detailed views on the resource constraints for the selected cluster. It contains the following tabs:

This tab displays a detailed view of the resource constraints for the selected cluster.

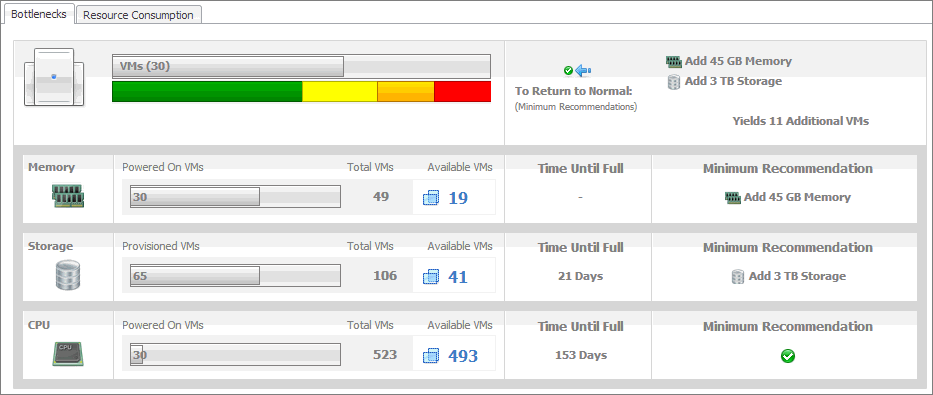
Provides an overall summary and is a visual readout of the current capacity mapped against the configured thresholds, as well as a set of suggested actions required to return to Normal (green) capacity settings.

To Return to Normal area displays one or more recommendations that, when followed, bring the system back to the Normal state.

Each resource row (Memory, Storage, and CPU) shows a visual representation of the powered on virtual machines relative to the total number of virtual machines that are considered available based on the levels of used resources. The levels of usage for each resource, gives you a good indication of what can limit the cluster’s overall capacity, allowing you to target only specific upgrades to achieve desired capacity.

The resources are listed in the order of constraining effect. The most constraining resource is shown on top, with the least constraining resource appearing at the bottom.

The number in the graph is the number of powered on virtual machines, compared to the Total VMs value.

The number of powered on virtual machines (Powered on VMs or Provisioned VMs) plus the number of available virtual machines (Available VMs).

The number of available virtual machines, as calculated using the Global Capacity Settings (see page 21). It is the total memory capacity minus the Amount Reserved and minus the amount of memory currently in use.

The period of time after which the resource is fully consumed, based on the last seven days of observed values.

The recommended amount of resources that need to be added to the cluster to bring the cluster to the Normal state. It represents the amount obtained using the following formula:

- Resource Capacity + Amount Reserved + Normal Capacity + Resource Used

If the recommended amount is less than zero '0', a green check mark is displayed.

Determined by the Capacity Management Mode (see page 22):

If Maximum Utilization is selected, no reserves are set aside, so the amount reserved is zero.
If N+1 is selected, resources are set aside for one extra host, so the amount reserved is calculated using this formula:
Resource Capacity * (1 / # of Hypervisors) * 100
If Percent Reserve is selected, the amount reserved equals the total resource capacity times the percent reserved.

Calculated using this formula:

(Resource Capacity – Amount Reserved) * Capacity Threshold Normal Value

This tab consists of the following views:

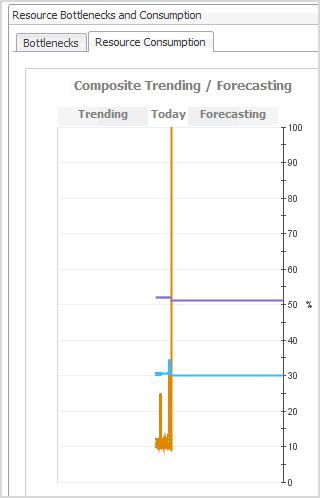
This view contains a consolidated chart showing each constraining resource of the cluster mapped over time.

The chart includes historical information, current values, and predictions of what the resource usage may look like in the future based on current trends and displays how quickly the rate of consumption or the available capacity can change over time. As these changes occur, a cluster’s resources can easily shift from being the most limiting to the least limiting over a period of time. For example, a cluster can be initially limited by memory, but given rapid storage depletion, storage may actually surpass memory as the most constraining resource in the long term. The composite graphing of historical, current, and predicted consumption provides a more accurate picture of what is happening in the cluster and better information on what steps to take in resolving issues.

This part of the chart displays the levels of resource usage based on historical data. The chart is more accurate when sufficient historic data is available.

Current levels of resource usage.

Forecasted levels of resource usage, for the next three months, based on historical data.

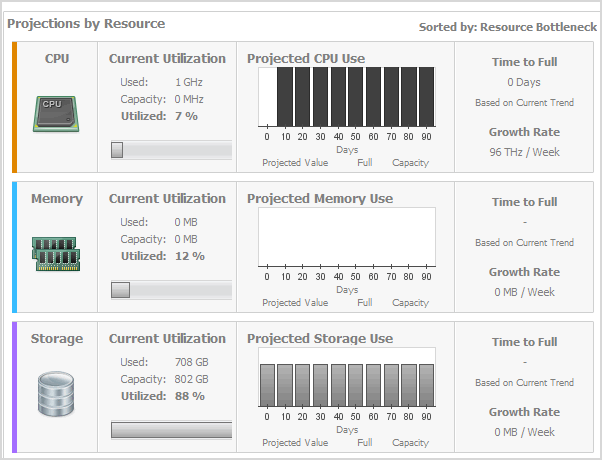
This view provides a detailed breakdown of the current status of each resource, projected consumption, growth rate, and remaining time of each until each of the key resources is fully consumed.

The colors to the left of the resource icons match the lines plotted on the Composite Trending/Forecasting chart appearing to the left of this view. For more information about this chart, see page 24.

The color of the bar charts shown in this view changes to black, indicting that the capacity threshold is reached. The resources are listed in order of bottleneck severity, with the most limiting resource shown first, and the least limiting resource shown last.

The amount of resources that are currently in use.

The total amount of resources in the selected cluster, including the amount of resources currently in use (Used) and the remaining available resources.

The percentage of total amount of resources (Capacity) that are currently in use.

The projected amount of resource usage over the next 90 days, based on the last seven days of observed values.

The period of time after which the resource is fully consumed, based on the last seven days of observed values.

The projected resource usage growth rate, based on the last seven days of observed values.

Documents connexes

The document was helpful.

Sélectionner une évaluation

I easily found the information I needed.

Sélectionner une évaluation