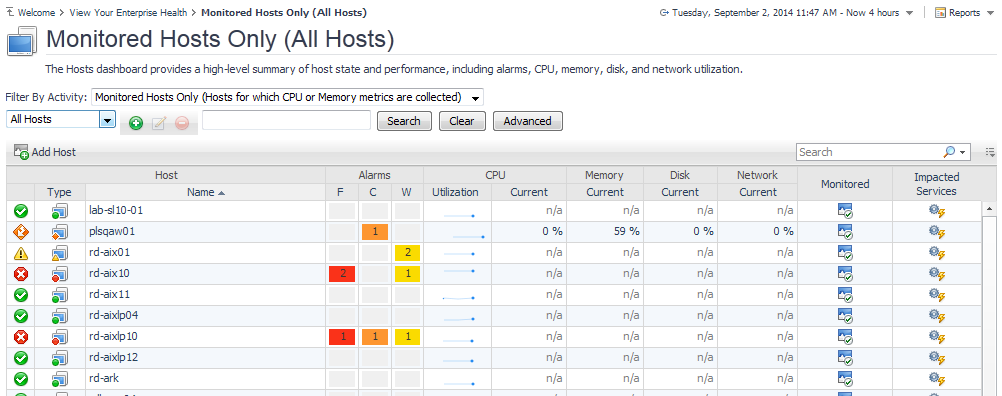
Monitoring Your Hosts
|
TIP: Visit http://eDocs.quest.com to watch our learning videos. See How to Use the Folflght Hosts Dashboard. |
Selecting a set of hosts to monitor
|
NOTE: If a Host is not currently being monitored, contact your Administrator to configure the host. For more information, see the Administration and Configuration Guide. |
If you need to see data for all hosts in your environment, you can:
|
• |
Work with the default settings in the Filter By Activity area and the menu underneath it (Monitored Hosts Only and All Hosts, respectively). |
|
• |
Select All Hosts from the Filter By Activity area and leave the default setting All Hosts in the menu underneath this area. |
|
TIP: If you have the Advanced Operator role, you can save the results of your search as a filter using the groups toolbar above the table. Type the search criteria in the field in this toolbar, click Search to filter the list of hosts by name, and then click the plus-sign button ( |
Identifying the types of hosts you are monitoring
Monitoring the state of hosts
Investigate a host’s alarms to get more details about the problems contributing to its non-normal state. In the row for the host, click the icon that represents warning, critical, or fatal alarms to display an alarm list filtered to show only the warning, critical, or fatal alarms for that host. See Viewing, Acknowledging, and Clearing Alarms for information about working with alarms.

