SQL PI captures blocking chains and session activity to help identify performance-impacting events. Understanding how session timing and event detection work is key to interpreting the data correctly.
This is an example of a blocking chain that was captured by SQL PI
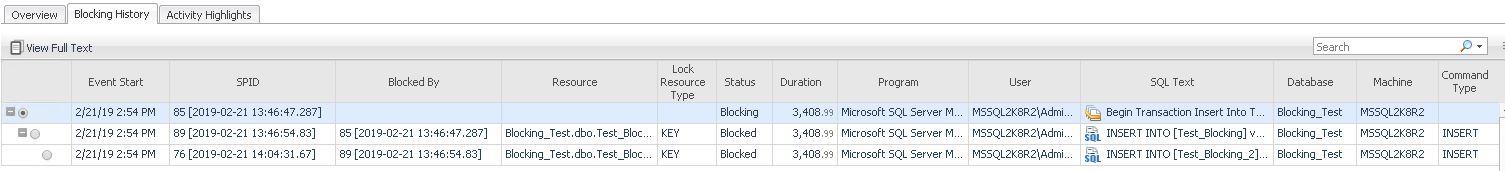
In this example the first column is collapsible where the + sign to indicate the chain of events.
Event Start indicates when the Blocking Event begins in local time to the UI.There are circumstances where the Event Start can be displayed before the SPID times. The login time of the session is taken directly from the database instance with no time zone manipulations. The event time is the time PI detected the event. It is stored in the repository at UTC time and is converted at UI time.
A SPID in SQL Server or Session [SID, Serial Number] in Oracle is the Server Process ID. These process ID's are essentially sessions. Everytime an application connects to SQL Server, a new connection (or SPID) is created.
Blocked by is the SPID number for the SQL statement that is blocking the statement emphasized in the current row.
Resource (in SQL Server) or Object Name (in Oracle) is the resource that is in conflict. This metric often identifies a database and table.
Lock Resource Type (in SQL Server) is the description of the resource that is locked (a row, index key, page, or table)
Status is the status of the session (blocking, blocked, deadlock). Blocking occurs when a database session is waiting on a lock held by another session.
Duration is how long the event has been running in seconds
Program is the name of the application that the user is currently running (for example SQL Server Management Studio)
User is the SQL Server login name for the session
SQL Text is the SQL text of the session that is blocked and/or blocking
Database is the name of the SQL Server instance database
Machine is the name of the client computer connecting to the instance
Command type is the current or previous command executed (e.g. INSERT, UPDATE, DELETE)
SQL PI is designed to surface the most impactful sessions affecting database performance. Sessions that started days earlier may still appear in views filtered to recent timeframes if they were active, blocking, or consuming resources during that period.
To manage storage, SQL PI rolls up data into coarser intervals over time:
| Time Resolution | Retention Period |
|---|---|
| 1 minute | 6 hours |
| 15 minutes | 3 days |
| 1 hour | 2 weeks |
| 6 hours | 30 days |
After 6 hours, only 15-minute or coarser data is available. During rollup, SQL PI retains only the top 300 combinations, which may include sessions from earlier dates if they were still relevant.
This behavior is expected and aligns with SQL PI’s design to prioritize performance insights over exhaustive logging.
