The following recommendations are part of an effective strategy for investigating SQL Server performance issues caused by slow queries:
Many SQL Server performance issues can be explained and identified with use of the SQL Server wait statistic by “asking questions” and by getting the answers on those questions from SQL Server
When a DBA asks SQL Server “why the SQL Server is running slow”, the SQL Server’s way to explain this is by answering that “because the query is slow as it has to wait longer than expected on signals and/or resources in order to complete execution”. And when the DBA then asks “OK, then what signals and/or resources query has to wait on and how long?”, SQL Server will answer by providing the information about what specific signals and/or resource wait types are involved including the amount of wait time that is accumulated for each wait type
|
Quick tip: The concept of the SQL Server wait statistic considers two basic categories: resource and signal waits. SQL Server process generates resource waits while waiting for some specific resources to became available during the execution. Signal waits are generated while the process is waiting for a CPU to became available in order to continue execution. In this case, process is waiting for “signal” from a CPU that it is available to affected process, and thus the name “signal waits” |
Investigate SQL Server performance issues using ApexSQL Monitor
ApexSQL Monitor is the SQL Server performance monitoring application that is capable of tracking individual query execution and collecting the wait statistic data for those queries as well as various information related to query executions that can be of additional benefit during the investigation of SQL Server performance issues caused by slow query performance
Instead of forcing DBAs to ask SQL Server those questions all the time, and wait for answers, and process and store “answers” somewhere in a way to ensure basic kind of analysis at least, ApexSQL Monitor can do that job automatically and unattended on behalf of the DBA. It will identify all queries that are running slower than expected, collect wait types and times accumulated during the query execution, store that information in the central repository database as long as it is required, and finally it will analyze and display that data in a way that will ensure that the most problematic queries can be easily spotted. In addition, ApexSQL Monitor can raise alerts and send notifications when the wait times threshold defined by the DBA is exceeded. Additionally, ApexSQL Monitor will collect and store information about other query performance related resources used by that particular query during execution such as CPU time, physical and logical reads, logical writes and I/O
|
Quick tip: When high times for query waits are detected in SQL Server, check the following before starting any deeper investigation and analysis:
|
The first step that has to be done is to define what amount of wait times accumulated for each query execution might affect the SQL Server’s performance. This should be defined to prevent unnecessary collection of the Query waits data for queries that will not affect the SQL Server performance in any way and thus avoiding the noise
The second step is determining what is the expected total wait time that a query can collect through the multiple executions during the day. This is also important as this will be used for determining the low, medium and high threshold for raising alerts when a query accumulates wait stats time above the expected values
To set the above mentioned:
|
Quick tip: Query monitoring is enabled automatically for each SQL Server instance added and ApexSQL Monitor will start collecting the Query waits data immediately after adding the SQL Server instance for monitoring It can be disabled for the selected SQL Server instance in the Queries tab of the Configuration screen by unchecking the Enable monitoring checkbox |
Change the value in the Store queries with wait time bigger than option to prevent collecting information on the queries with a wait time lower than the one defined explicitly by the user. The default ApexSQL Monitor time is set to 1 second to ensure the high resolution of query collection. Such default value is set to allow DBAs that are less experienced or still not enough familiar with SQL Servers they are maintaining, to collect enough data initially to make the knowledgeable decisions whether they want/need to change that value.
The Enable alerting thresholds for low, medium and high are set to 5,000, 20,000 and 60,000 ms respectively, by default. Those are the “safe” threshold values that should prevent excessive query wait alerts after performance monitoring has started, but also proactively inform when some queries with excessive wait times are detected
Please note that these values are highly dependent on the individual SQL Server/system that is monitored, and if any excessive/lack of alerting is detected upon analyzing collected queries, those values should be changed to accommodate the specifics of each monitored SQL Server/system (lower the values if no alerting even when SQL Server is experiencing issues, or rise the values in case of false positive alerts are triggered)
Now that the Query waits feature is configured properly, the DBA can review the collected query waits data and notifications received as relevant and sufficient for investigating SQL Server performance issues via the Query waits feature
For the purpose of this article, a real-world use case will be presented to show how the Query waits feature can help identifying the root cause of the SQL Server performance issue
The DBA received a ticket from a user that the application has slowed down significantly during the 45 minutes between 12 PM and 1 PM causing the interruption in normal workflow and data processing. The DBA’s first reaction is to check what queries were running when the reported performance issue is registered and to identify queries that could be the root cause of the issue:


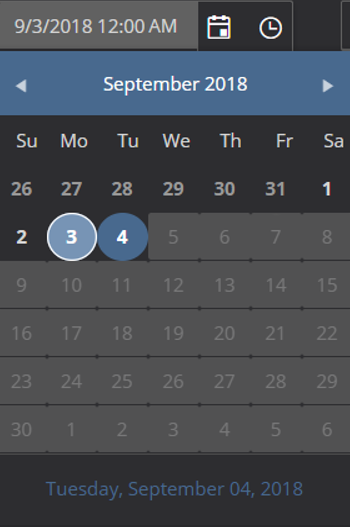
In this particular case, since the specific period should be investigated, select the specific hour when the performance issue has been reported which is 12PM

The chart will show what queries are with the highest wait times can be found in the chart. The queries with the highest wait times accumulated during the chosen period of time will be displayed in descending order from left to right
It is clear from the chart that there is a query that stands out in that particular period, and this initial information allows narrowing down the performance problem. The next step should be to investigate this query in detail.
The table below chart in the Query waits tab shows all individual queries execution in the selected time period. We can see query ID, Database, Total wait (ms), Execution time, Execution count and open the Execution plan.
To get more details about individual query execution, select the “>” at the beginning of the line row
The Query details tab is displayed as the default tab, after expanding the details, and the most important information for troubleshooting can be found here.
Even though this looks like a clear case where the root cause is determined, and now the focus should be on investigating wait type and causes for such high wait times, there is one more step that has to be done before jumping into any further troubleshooting. The DBA should check whether this is the deviation from the normal query behavior, or maybe the query is regularly slow, which would mean that it might not be the root cause for the SQL Server performance issue that is subject of this investigation
Having this in mind, the next logical step would be to check the query text. To do that, select the SQL text tab.
Just for the reference, it is not unusual that during the investigation of the query. The DBA could easily jump to a wrong conclusion without checking the query behavior and thus troubleshooting the false positive indication of the issue. To illustrate this, take a look at the chart below.
As we now want to investigate queries in details, we can click on link (Q#1716819023) and go to Query waits single page and see all details for selected query.
This particular chart shows that such high wait times are standard for the suspicious query and that the similar high wait times are usual through the whole period including the periods when SQL Server was not affected with reported performance problem. This example serves to demonstrate the importance of checking the query; what initially looks like as the query with some high wait times worth of further investigation and troubleshooting, could be actually rejected as conclusion early in the process of investigation after checking the historical data.
One last check that have to be made is the query behavior in the previous week in the same day when SQL Server was not affected. This is important to check as comparing the same day in a week one week before when SQL Server is not affected with any performance issue, will confirm that specific query wait stats values that were read during the period when SQL Server experienced performance issues are not only higher comparing to the wait stats values measured in different parts of that day, but also that there is discrepancy comparing to the same.
The image above shows that the query “Q#1716819023” values are almost 2,000 ms and that there are no spikes in that period. Now we can be sure that the behavior and spike for the query “Q#1716819023” is not normal behavior and that this particular query is the most probable cause of the performance issues experienced during the reported time frame
In addition, ApexSQL Monitor can provide you some more details about the wait stats types and see it in Query statistics chart
To see the helper dialog for the involved wait type just expand on ‘>’ and mouse click on the Wait type name in the Query details
This will open the helper dialog with details and advices. Below are the examples of SOS_SCHEDULER_YIELD and LCK_M_U wait types involved in this article
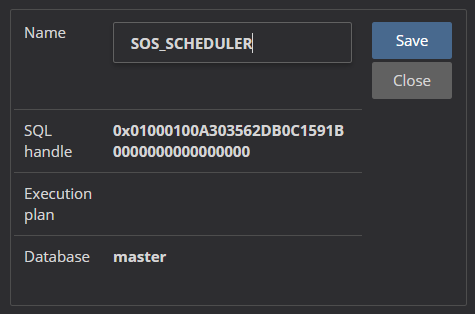
In order to keep an eye on this query in the future, it is recommended to name that query in such a way that issues can be spotted and recognized much easier if similar situation repeats
To do that


From now on, every time when this particular query is shown in the Query waits page table, it will be displayed with the newly assigned name