Reloading the Server-Side Hierarchy Cache
If the ControlPoint Application Administrator has configured ControlPoint to load site collections in the SharePoint Hierarchy from a server-side cache rather than in real-time, you can reload the server-side cache on an as-needed basis (for example, if a site collection has just been added or deleted) as follows:
From the Manage ControlPoint tree, choose ControlPoint Management > Reload Server-side Hierarchy Cache.
CAUTION: A reload of the server-side cache is a resource-intensive process that may affect application performance for all ControlPoint users.
This action will have no effect if the ControlPoint Configuration Setting PRELOADSITECACHE is set to false.
After reloading the server-side cache, you will need to refresh the SharePoint Hierarchy to clear the browser-side cache as well.
Using Discovery to Collect Information for the ControlPoint Database Cache
ControlPoint Discovery is a tenant-specific background task that collects information and stores it in the ControlPoint Services (xcAdmin) database cache for use in ControlPoint data analysis and reporting.
·for use in ControlPoint data analysis and reporting
·to populate and update statistics lists used to create dashboards.
Discovery is triggered by the ControlPoint Discovery Service to run on a pre-defined schedule.
If you want to ensure that your ControlPoint analyses have the most recent cached datayou can run the Discovery process interactively from the ControlPoint application. The ControlPoint installer includes the option to configure the Discovery Service.
If the ControlPoint Discovery Service is not installed, the operations and parameters that rely on cached data collected by Discovery are disabled.
Running Discovery Interactively from the ControlPoint Application
ControlPoint Application Administrators can run the Discovery Service interactively from the ControlPoint application interface between scheduled Discovery runs.
NOTE: For Discovery to be run interactively, the Discovery Service must be installed, configured, and running. Refer to the ControlPoint for Office 365 Administration Guide for details.
To run a ControlPoint Discovery interactively:
1From the Manage ControlPoint panel choose ControlPoint Management > Discovery.
NOTE: If you are not a ControlPoint Application Administrator, this option will be hidden.
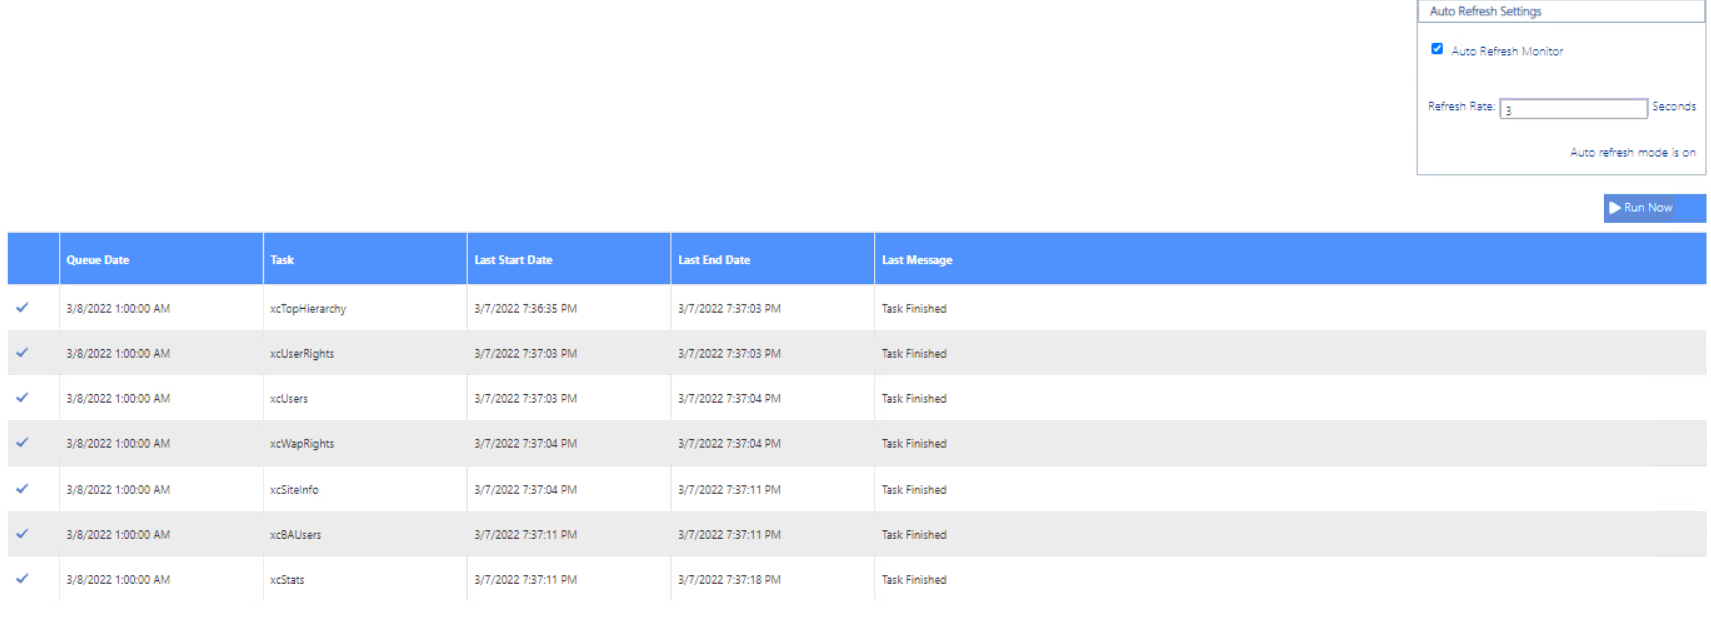
2Click [Run Now].
The results show each table in the ControlPoint Services (xcadmin) database that the Discovery Service collects data from. The Auto Refresh Setting will refresh results every 3 seconds by default, but that value can be changed.
NOTE: The Queue Date is the date and time of the next scheduled Discovery.
The GDPR Dashboard
If your organization is subject to General Data Protection Regulation (GDPR) compliance, the GDPR dashboard provides an overview of how your organization is using ControlPoint to manage regulation-sensitive areas of your SharePoint environment.
GDPR dashboard statistics are populated based on usage of the following functionality:
·SharePoint Audit Settings
To access the GDPR dashboard:
From SharePoint Hierarchy farm node, choose GDPR Dashboard.
The GDPR Dashboard displays the following information:
·the Number of Site Collections in your tenant as of the last ControlPoint Discovery run.
·If your organization uses Sensitive Content Manager:
§Number of Active PII Audit Reports represents the number of Sensitive Content Manager jobs scheduled to be scanned.
§Sensitive Objects Scanned in SharePoint shows the number of documents determined to contain sensitive content compared to all items scanned within a given month.
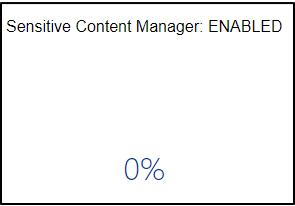
§the Sensitive Content Manager: ENABLED donut graph shows the following percentages:
oThe light blue section represents the percentage of site collections containing content for which at least one scan has been performed PLUS site collections that have at least one Active PII Audit Report.
NOTE: This percentage is also the number that displays inside the donut graph.
oThe medium blue section represents the percentage of site collections containing content for which at least one scan has been performed.
othe dark blue section represents site collections that have had no Sensitive Content Manager activity.
If you have never used Sensitive Content Manager, this section will always display 0%.
·If your organization uses ControlPoint Sentinel, Anomalous Events Detected represents the number of deviations in document views and downloads from individual users' "typical" daily usage patterns
·Sites with Auditing Enabled represents the percentage of site collections within your SharePoint tenant for which all audit settings are enabled.
NOTE: If any of the site collection audit settings are not enabled the site collection will not be counted in this percentage.


