
Understand a Table Using the Database Explorer

|
Scenario You need to build a query listing customers and want to know more about the table before writing the query. Note: This exercise uses the Toad Sample Database. This connection does not have the relationship and script tabs. The tabs available can differ depending on the type of connection. |
Note: This topic focuses on information that may be unfamiliar to you. It does not include all step and field descriptions.
To understand a table using the Database Explorer
-
Connect to the Toad Sample (Access) database in the Navigation Manager.
- Right-click the CONTACT table and select View Details.
- View information for the following:
- Click the Indexes tab and view the index information.
- Click the Primary Keys and Foreign Keys tabs to view relationships.
- Click the Data tab.
-
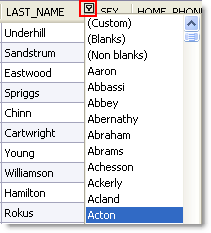
Place the cursor over the LAST_NAME column, click
, and select Acton.
The only row that now displays is the one with Acton as the last name.
- Click
- Click the CONTACT_ID column to sort the rows in ascending or descending order.
-
Click
-
Create the following filter in the Where Clause tab:
CONTACT_ID > 2000
The filter string displays at the bottom on the grid. Click
to remove the filter.
-
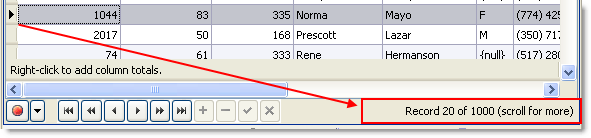
Select a row of data in the grid. Notice that the row number changes in the bottom right of the status bar:
- Under the SEX column, right-click the area below the last row in the grid that says "Right-click to add column totals" and select Count. The total number of rows that have either a M or F value display.
- Click
- Click
-
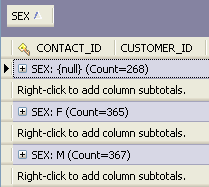
Select the SEX column header and drag it the area above the columns that says "Drag a column header here to group by that column":
You can expand each group to view the row data.
- Switch the default view:
- Right-click within a group or row on the grid and select Show | Card View.
- Scroll through some records.
- Click Customize in the Card View window.
- Click Filter beside the ADDRESS_ID column and select 100. Notice how the card view is filtered, but not the grid view.
- Close the Card View window.
- Edit a row:
- Select a row in the FIRST_NAME column and edit the value.
- Press ENTER to update the row.
-
Go to the BIRTH_DATE column and use the date picker to change the date.
Each data type have an appropriate editor.
Note: If you are using Oracle or a database that does not have auto commit on, you will need to press Commit at the left hand bottom of the window.
- Update the number of rows in in the data:
- Select Tools | Options | Database | General from the menu.
- Enter 50 in the Number of rows to initially fetch in data tab.
- Click OK.
-
Press F5 in the data grid. Notice the bottom right status bar now says "1 of 50 (scroll for more)".
The option you set controls the number of rows fetched in the Data tab.
- Click the scrollbar and hold down to retrieve more.
- Right-click the grid and select Read All Rows.

Search for Objects
You can quickly locate an object rather than browsing through a list of objects in the Database Explorer orObject Explorer. Object Search locates the following:
-
Names of objects for a string.
-
Text in objects that include source code, which typically includes procedures, functions, triggers, data types, and views. However, the database provider determines which objects include source code.
-
Variable names and comments in the object's source code.
-
Column names for tables and views.
To search for objects
- Click
on the toolbar (F4).
-
Specify search criteria and click Search.
Note: To append additional search results to the current search, click Append instead. If you click Search, new results replace the previous search results in the data grid.
Tips:
-
To remove objects from the search results, right-click the objects in the data grid and select Remove Items. This is useful if you want to narrow the list of results to relevant objects.This does not remove the objects from your database.
-
To create a DDL script from the search results, right-click the data grid and select Create DDL Script. You can then paste the results into the Editor.
-
To perform any actions available for the object, such as creating, altering, dropping, exporting, and generating reports or SQL, right-click the results in the data grid and select an option.
Create an Database Diagram to Use as a Query Template
|
Scenario Your company creates several daily and weekly reports regarding customer sales. You need to create a Database Diagram that can be used as a template for these queries. |
To create a Database Diagram to use as a query template
-
Connect to the Toad Sample (Access) database in the Navigation Manager.
- Select Tools | Diagram.
-
Drag the CONTACT table in the Object Explorer to the Diagram pane.
-
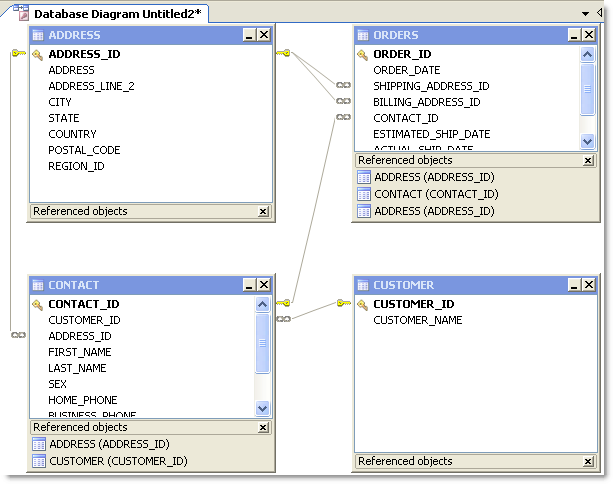
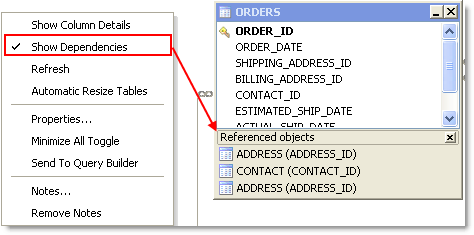
Right click the Diagram pane and clear Show Dependencies to hide the Referenced Objects at the bottom of each table/view, as illustrated in the following screen capture.
- Right-click the ORDERS table and select Notes.
-
Enter the following note in the window for other users:
The shipping and billing ADDRESS_ID foreign key relations are not needed in most queries and should be hidden when building a query.
-
Because it is against company policy to display sex and a home phone number in reports, right click on each of these columns in the CONTACT table and select Hide Column.
Tip: If you have a large number of columns you need to hide, you can right-click a table and select Manage Hidden Columns to quickly select them from a list.
- Click Add to Project from the wizard bar at the bottom of the window and enter DBDiagram_Test asthe name for the file. This adds the file to the current project in the Project Manager under a Diagrams folder.
- Close the Database Diagram window and open the Project Manager window.
- Expand the Diagrams folder and double-click DBDiagram_Test to reload the file in a new Database Diagram window.
- To share your project, hidden columns, and notes with colleagues, complete the following:
- Select Tools | Options | Environment | Network Share, and navigate to a shared drive where you want to store the Project Manager file.
- Select Database | Cache from the open Options window and set the following options:
Object An notation Cache Description Share object annotations Select this checkbox and enter a shared drive location where users can access this file. Share hidden column settings Select this checkbox. - Provide the location of the Network Share and Object Annotation Cache settings to colleagues who need to use this diagram.
Browse Data in Related Tables
Use the Master Detail Browser to browse data in parent tables and drill-down to data in related child tables. This is useful when you need to analyze or edit data. For example, suppose you need to view a list of all Nick's Flix stores and the inventory of comedy movies at each store. Using the Master Detail Browser, you specify the table that contains the list of stores as the parent table and specify the table that contains comedy movies as the child table to quickly locate comedies and analyze the inventory.
To browse tables using the Master Detail Browser
-
Select Tools | Master Detail Browser (ALT+T+A).
-
Drag one or more tables from the Object Explorer, Object Search, or Project Manager window to the Diagram pane at the top of the Master Detail Browser. Press CTRL+click to select multiple tables at once.
Notes:
-
A line between tables indicates any existing relationships between the selected tables.
-
At least one parent table (table without any join arrows pointing to it) must be added to the window or an error message displays when returning results.
-
-
Join Columns.
-
Select the checkbox beside each column you want to include.
Note: Any columns included in a join are automatically included in the results.
-
Click
(F9) to retrieve data for the parent table initially. To view data in a child table, click + to the left of each row.
or
Click
to retrieve data in the parent and child tables. If there is more than one child table, a tab displays for each child table.
-
From the data grid, you can:
-
Edit the data and commit your changes to the database.
-
Right-click the data grid and select Send To | option to add the data to a report, chart, or pivot grid.
-
Tips:
-
Click
to align tables and snap them to the grid.
-
Select the parent table from the drop-down list in the toolbar to view data for a parent table if there are multiple parent tables.
-
Click X on the table you want to remove in the Diagram pane to remove a table and any conditions (e.g., join, where clause) associated with the table.