
Monitoring
Day to day administration of migration activity
The tasks that need to be performed from day to day during an Archive Shuttle based migration vary from project to project; however, aspects that should always be performed are:
Monitoring Module-Level Activity
Adjusting Priority of Migrations
Pausing, Resuming, and Skipping Workflow Steps
Setting Users Up for Migration
Configuring, Loading, and Saving Filters
Performance of the migration can be viewed in various ways within the Archive Shuttle Web Interface and can be exported to a variety of formats. It is recommended to review the following:
Progress & Performance
Over a period of time, the number of containers (users) processed should start to increase. In fact, all the statistics should rise towards 100% during the migration. It is also possible to view the information displayed on this page both for the overall progress of the migration and an individual link level. To get a fine level of detail on the progress of a migration, it is also possible to show the graphs on the page as items/second rather than items/hour.
The data which is displayed and the order it is displayed in can be customized to meet the needs of the particular migration. These views can be stored, and can be switched between when required. Each chart or data grid is a widget that can be moved around the screen, or removed by clicking on the small x at the top right of the widget. Once removed, widgets can be re-added if required.
Link Statistics
Ensure each link is progressing towards 100% over time
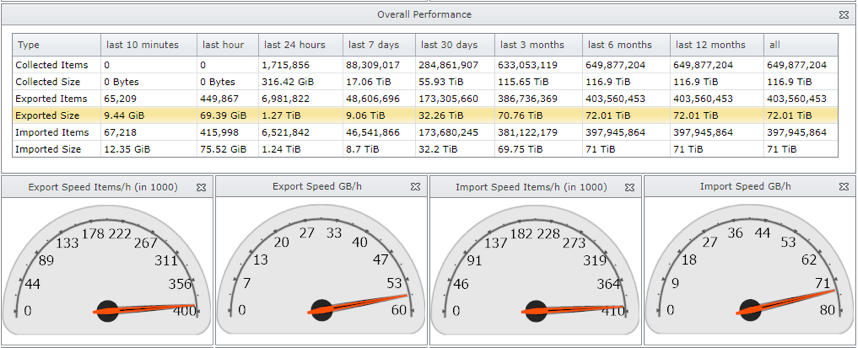
Performance
Once steady-state migration has been reached the number of items being exported and imported per hour should be fairly consistent.
System Health
Ensure that the Free Space amounts do not reach a warning or critical level.
Also ensure that modules are not deactivated or otherwise not running.
Finally ensure that the link used space is within normal parameters.
Monitoring workflows involves reviewing the Stage 1 Status screen for hangs and failures. By default, the number of export errors and the number of import errors are shown as data columns on the screen. Additional data columns can be added (by clicking on Columns in the Actions Bar and dragging additional columns on to the data grid).
The Stage 1 Status screen can also be filtered and sorted to show (for example) all containers with less than 100% imported. This can be done as follows:
1.Navigate to the Stage 1 (Sync Data) screen.
2.Click Reset on the Actions Bar in order to return the page to the default view
3.In the text box under Imported Percentage enter 100.
4.Click on the small filter icon to the right of the text box, and choose is less than from the pop-up list
5.Click on the Apply button at the right of the filter row.
The page will now show those containers that have been enabled for Stage 1 that have not reached the 100% import stage.
Monitoring Module-level Activity
Valuable information about module-level responsiveness can be gained from the Module Dashboard in Archive Shuttle. Using the dashboard it is possible to see detailed information relating to the operations being performed by particular modules on particular servers involved in the migration. For example, if new mappings have just been created, and yet one or more Enterprise Vault Export modules are showing no items being exported, it may indicate an area that should be investigated further.
Adjusting Priority of Migrations
When reviewing the data synchronization on Stage 1, it might be necessary from time to time to adjust the priority order that they are running. A good way to do this is to ensure that all new mappings are created with a priority of 10, then, other priorities can be assigned on the Stage 1 screen in order to raise or lower the priority of particular mappings.
|
|
NOTE: The lower the priority number, the higher the priority. |

Monitoring migrations involves reviewing the Stage 2 Status screen for failures. Each command, performed by the appropriate module, will report back results to the Archive Shuttle Core.
This screen can also be filtered to show (for example) all containers that have not yet finished the migration completely. This can be done as follows:
1.Navigate to the Stage 2 (Switch User) screen.
2.Click Reset on the Actions Bar in order to return the page to the default view
3.In the drop down list under Finished select No.
4.Click on the Apply button at the right of the filter row.
The page will now show those containers that have been enabled for Stage 2, but have not yet completed the migration.
Pausing, Resuming, and Skipping Workflow Steps
Particular steps in a Workflow can be paused, resumed or even skipped. This can be done as follows:
1.Navigate to the Stage 2 Status screen.
2.Click Reset on the Actions Bar in order to return the page to the default view
3.Select one or more containers.
4.Click the appropriate action button, e.g., Pause, Suspend, Resume.
At any time a particular container mapping can have the workflow changed to a new one. In order to do this, perform the following:
1.Navigate to the Stage 2 (Switch User) screen.
2.Click Change Workflow Policy on the Actions Bar
3.Select a new workflow for this mapping.
4.Click [Save] to commit the change.
Once a new workflow has been selected, all previous workflow steps will be removed for the mapping and the new workflow will begin with the first command in that workflow.
This can also be used to re-run a chosen workflow associated with a container mapping.
Setting Users Up for Migration
Most archive migrations are performed by selecting groups or batches of user archives (containers) to process through Stage 1 and Stage 2. The mapping and selection is performed on the Bulk Mapping screen in the Archive Shuttle Web Interface. This screen can be filtered and sorted with the current list of data columns, and additional data columns can be added to help facilitate the selection of containers.
There are many ways that the selection can be defined. Below is an example of selecting users based on the source Vault Store:
1.Navigate to the Bulk Mapping or Manual Mapping screen.
2.Click Reset on the Actions Bar in order to return the page to the default view
3.In the text box under Link Name enter the name of one of the source Vault Stores, and press enter or click into a different text box
4.Click the Apply button at the right of the filter row.
The page will now refresh to show all archives (containers) in that particular Vault Store (link).
This selection can be further refined, before selecting some or all of the containers and performing the Add Mapping function from the Actions Bar.
Configuring, Loading and Saving Filters
Both the Stage 1 (Sync Data) and the Stage 2 (Switch User) pages in the Admin Interface allow for additional, useful data columns to be added to the screen. These can be re-arranged and sorted as required.
Both of these pages also allow for these filters, and column configurations to be saved under a friendly name. Previously saved filters can be loaded, allowing an administrator to jump between slightly different views of the migration.
|
|
NOTE: The filters are saved per user and can be used on any machine that accesses the Admin Interface from the same Windows account. |
Monitoring a migration
Its important to monitor Archive Shuttle during a migration. This article gives advice on the things to monitor.
Active systems
Archive Shuttle works best at scale. Migrating a few hundred items is not what it is intended to do. Fully utilized systems ensure that all aspects of the system, the workflow and processes are busy.
Progress & Performance
Take a look at the Progress & Performance screen in the user interface.
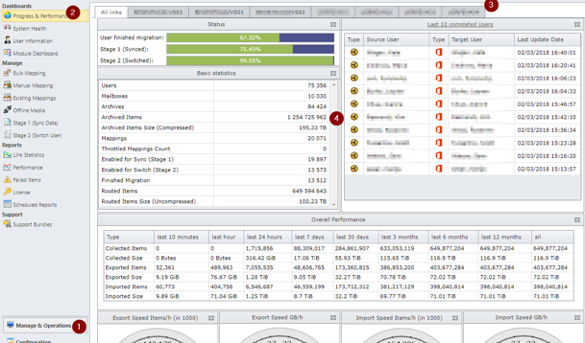
This dashboard is modular, meaning you can re-arrange widgets, remove ones which arent needed and store that layout to use later. The page can be configured to automatically refresh (for example every 60 seconds).
The dashboard gives a great overview of the overall health of your migration.
In the graphic above we ask the question whether there is any potential issue with the highlighted statistics.
Red box
Overall things look healthy, however export is slightly slower than import. This means that eventually the system will run out of work to do.
Green box
Collection of archived item metadata is currently not happening. That could be completely normal.
Blue box
This again is showing that import is currently faster than export, and that may mean that the system will run out of work to do.
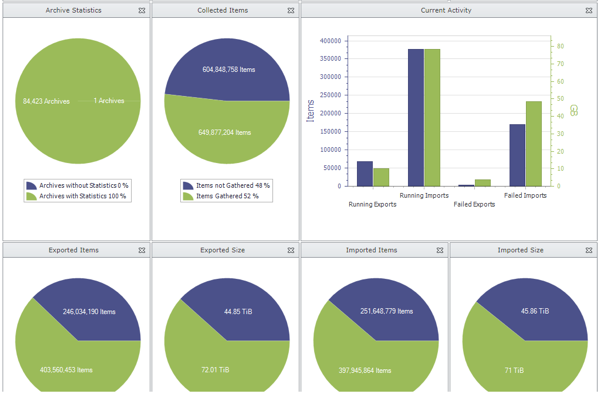
Lower down on the Progress & Performance page are more indicators about the overall health of the migration.
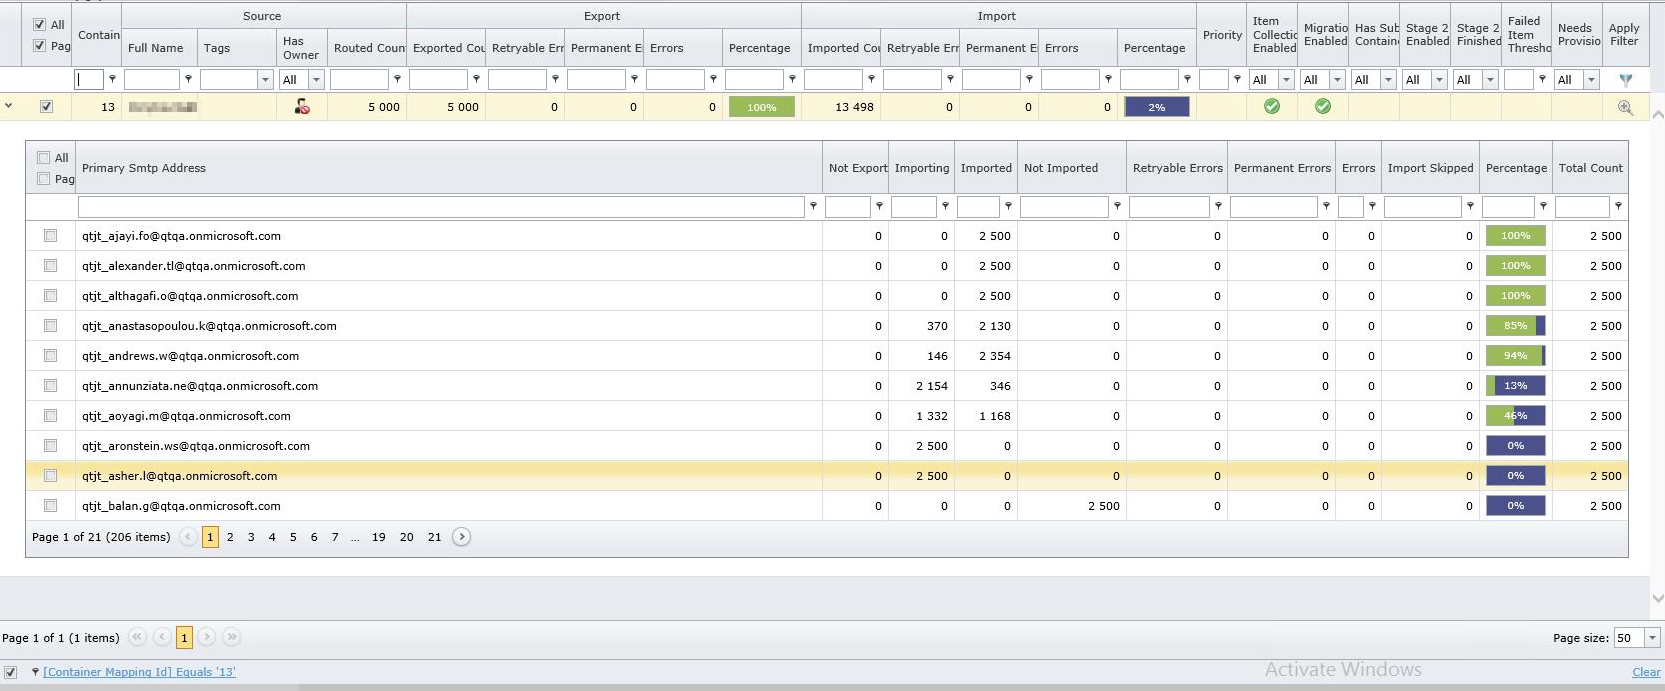
Stage 1
Stage 1 does all the heavy lifting in a migration, and if Stage 2 is not enabled, Stage 1 will continue topping up the migration (with any additional archived items from the source environment).
Conditional formatting is applied to results:
·Containers with no items are shaded blue
·Containers with rows in red are potential issues
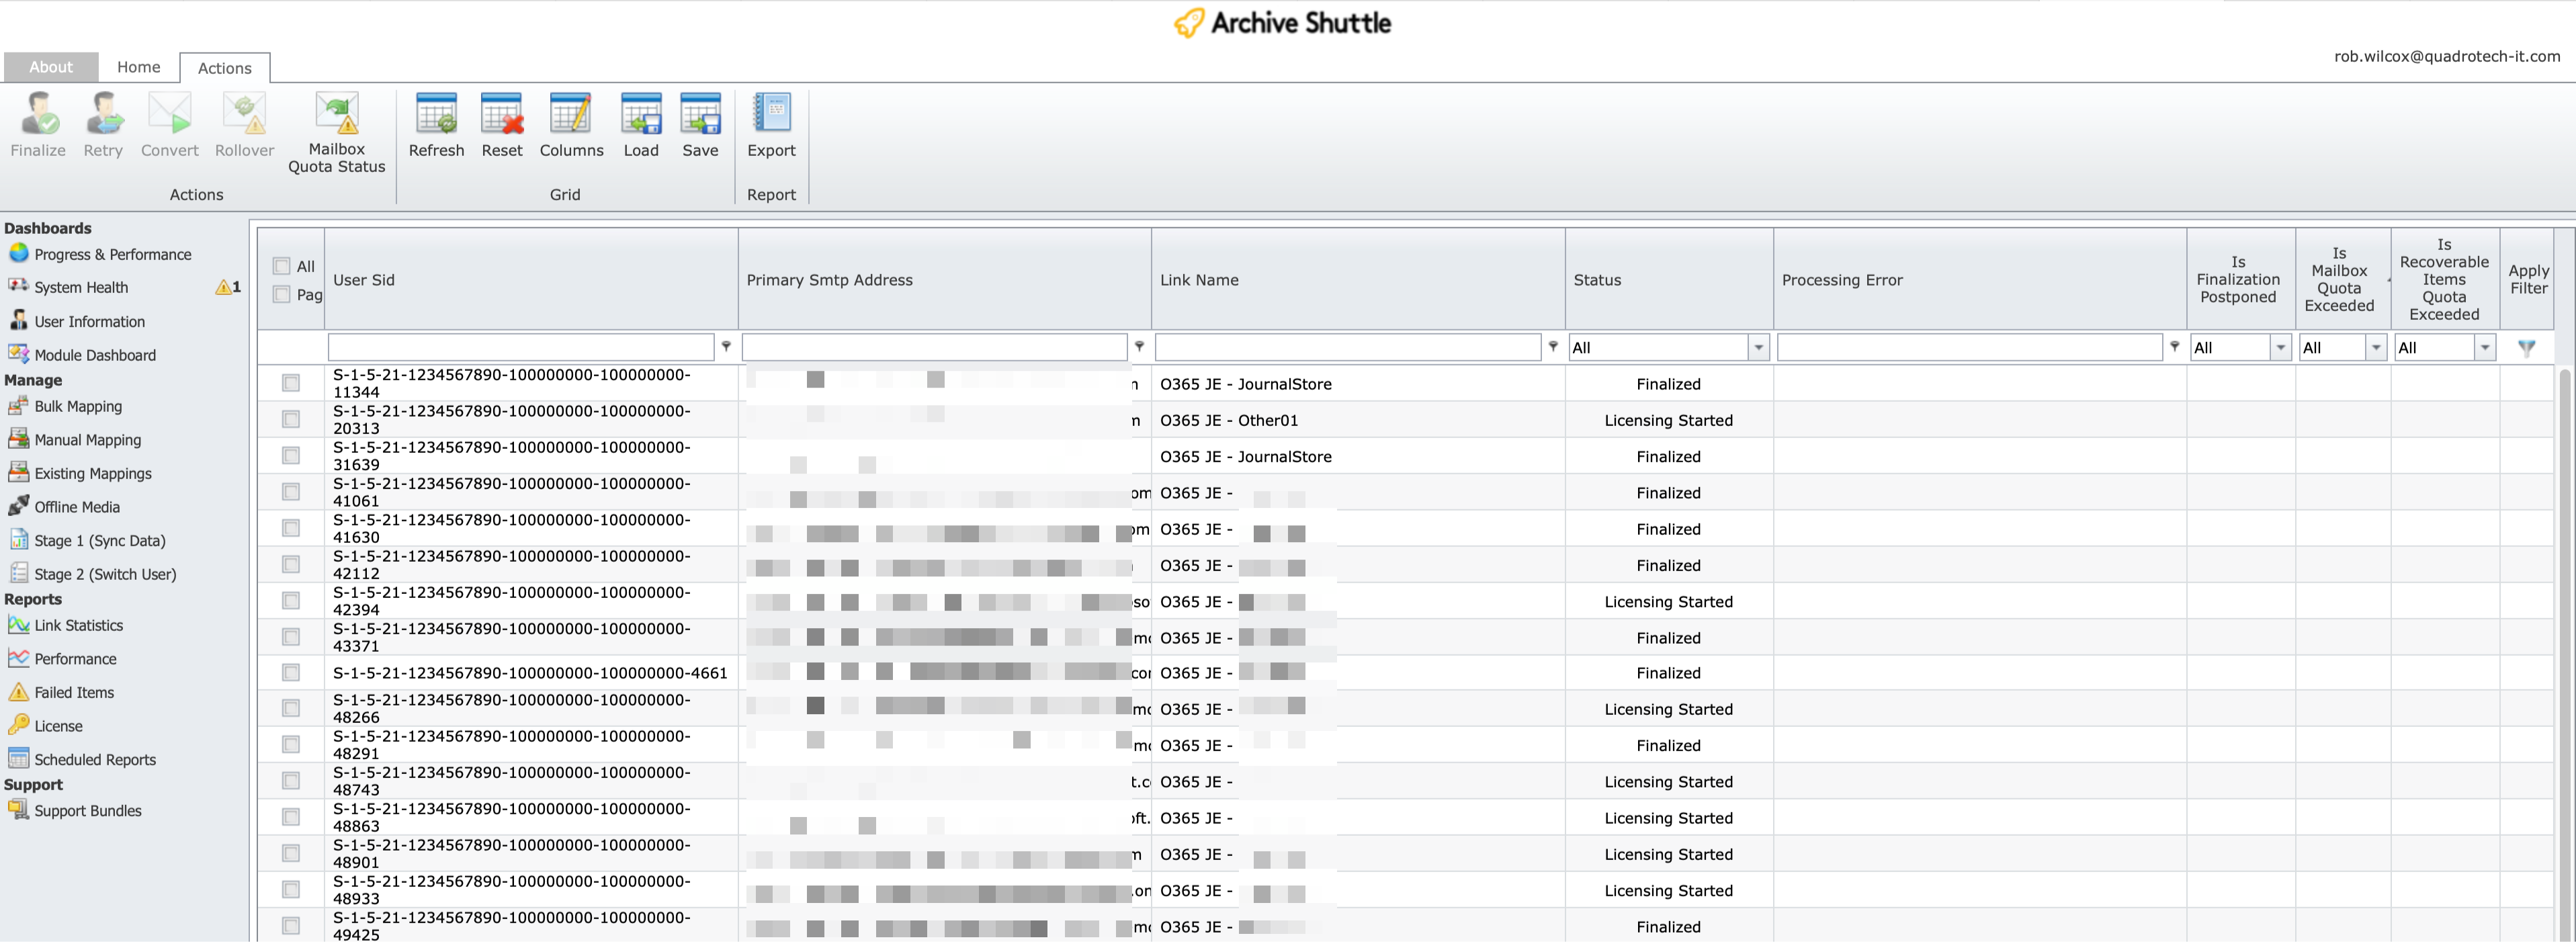
More examples of the Stage 1 page showing a journal migration in progress:
Leaver status
From the User Management page, you can access the remediation page.
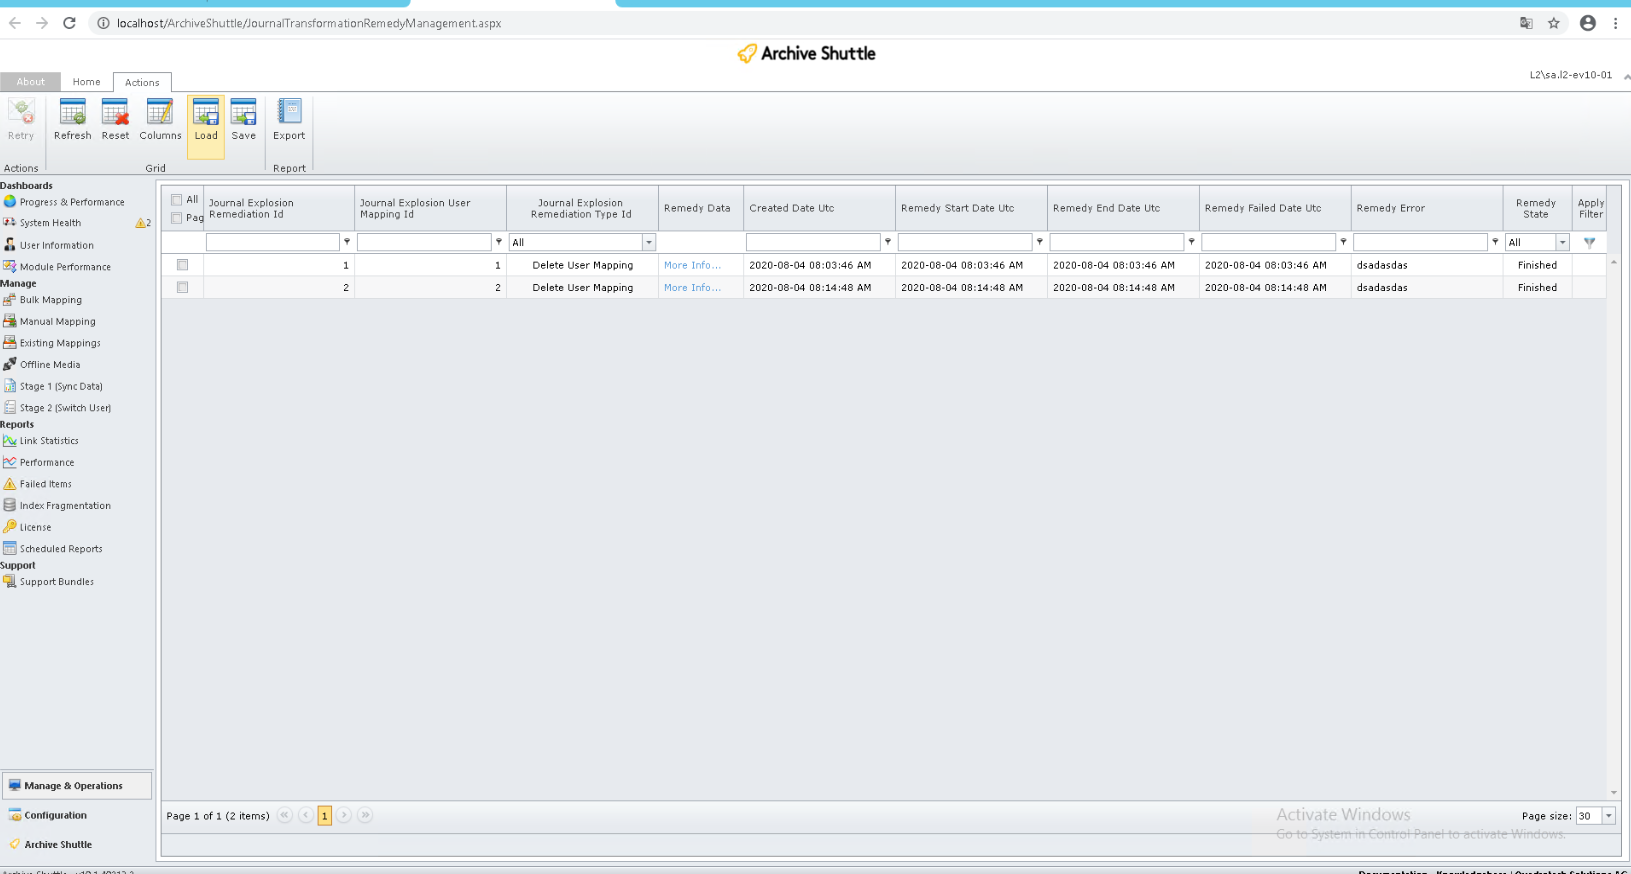
Here you can see the status of any remediation activities which have taken place on user mappings.
Remediation status
If youre processing leavers, then reviewing the leaver provisioning status page is essential. You can access it from here:
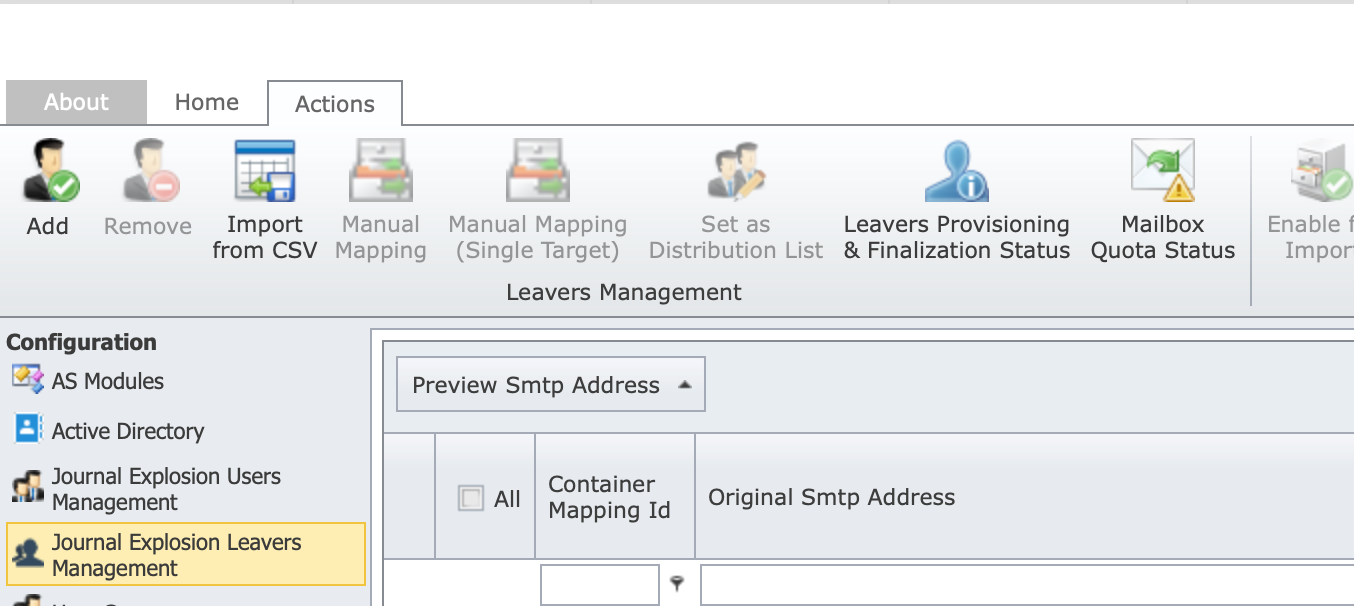
Again this page can be sorted and filtered to try to pick out any problematic users.
Base system
Monitor the base or basic Journal Commander System will ensure fundamental operational activity. One of the ways to proactively monitor the system itself is to use the HealthCheck API.
Completing a journal migration
In this section well review some of the things that need to take place at the end of a migration using Archive Shuttle.
Progress & Performance
The summary information at the top of the Progress & Performance gives a good indicator of what has progressed in the migration.

Failures
Failures during the migration are inevitable.
Assuming that the source environment is fairly healthy the actual result in most migration is just a tiny fraction of a percentage, but a small fraction can still appear to be tens of thousands of items:
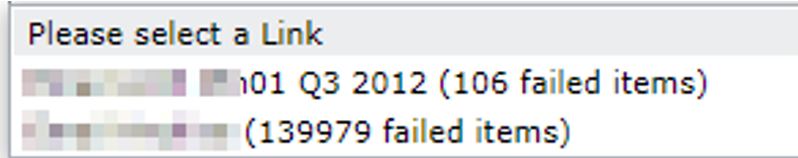
In this example 140,000 failed items is actually 0.069% within the migration.
Further, with this example, most items failed to export from the source meaning that source integrity was a possible issue.