Chat now with support
Chat with Support

Foglight Agent Manager 5.9.2 - Foglight Agent Manager Guide

Configuring the embedded Agent Manager Installing external Agent Managers
Understanding how the Agent Manager communicates with the Management Server Deploying the Agent Manager cartridge Downloading the Agent Manager installer Installing the Agent Manager Starting or stopping the Agent Manager process Frequently asked questions
Configuring the Agent Manager Advanced system configuration and troubleshooting
Configuring Windows Management Instrumentation (WMI) Configuring Windows Remote Management (WinRM) UNIX- and Linux-specific configuration
Monitoring the Agent Manager performance Deploying the Agent Manager to large-scale environments

Misbehaving Clients tab

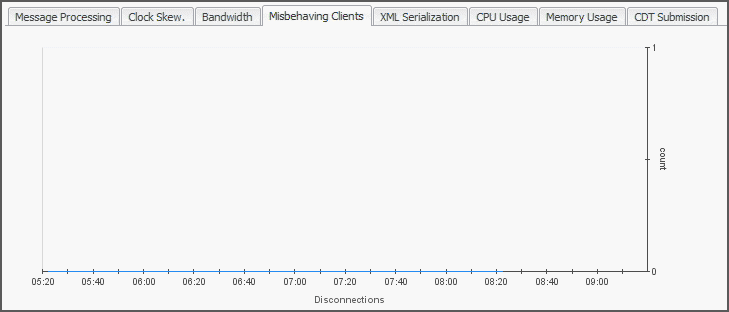
The Misbehaving Clients tab displays the disconnections per count for a selected Agent Manager instance.

Figure 9. Misbehaving Clients tab

XML Serialization tab

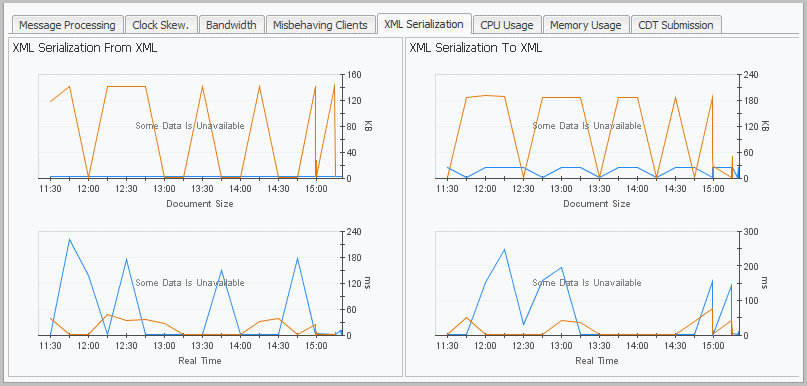
The XML Serialization tab shows graphs indicating the rates and times of message serialization to and from XML for a selected Agent Manager instance.

Figure 10. XML Serialization tab

CPU Usage tab

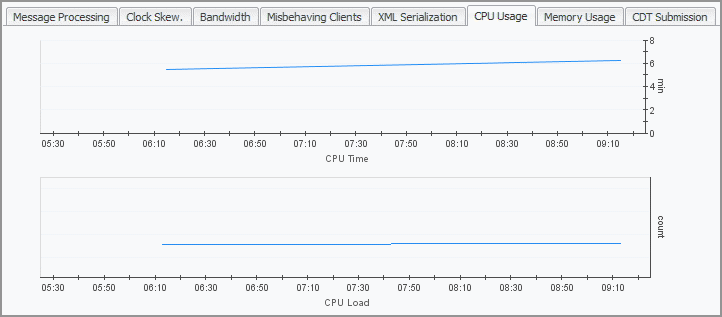
The CPU Usage tab displays the amount of time the CPU associated with a selected Agent Manager instance spends executing active processes and their number. For example, a sudden increase in CPU time may indicate that the user code is running inefficiently or a possible runaway process. Also, high CPU loads sometimes suggest that the host needs more CPU power to run efficiently.

Figure 11. CPU Usage tab

Memory Usage tab

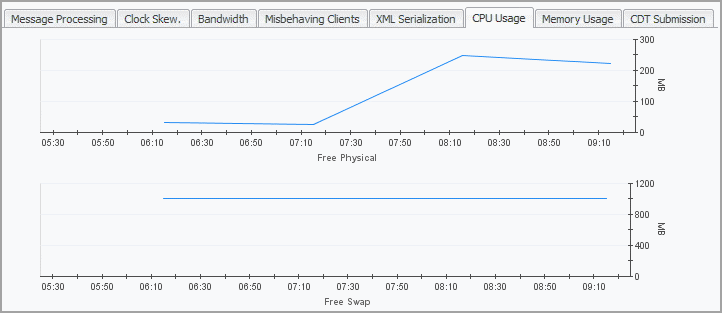
The Memory Usage tab displays the amount of available memory and swap space for a selected Agent Manager instance. For example, a shortage of swap space often suggests a memory shortage, while a decline in the available memory may indicate a memory leaking process.

Figure 12. Memory Usage tab

Related Documents

The document was helpful.

Select Rating

I easily found the information I needed.

Select Rating