Chat now with support
Chat with Support

Foglight for Application Operations 5.9.8.5 - User Guide

Introducing Foglight APM Monitoring Transactions Examining Response Times Examining Error Breakdowns Viewing Real User Activity from a Geographical Perspective Using the SOC Transactions Tab Using the SOC for APM triage Creating Custom Drag-and-Drop Dashboards APM Tile and View Reference Appendix: Enabling End User Transactions from FxM and FxV

JMX tile

The JMX Tile summarizes the performance of a JMX Server system monitored by the Cartridge for JMX. Use this tile to gather performance information about the state of JMX MBean transactions.

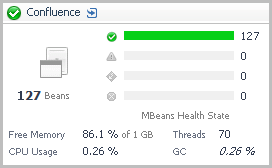
Topology Object Name: JMXServer

MBeans. The current average number of MBeans.
MBean Health Breakdown. The current number of MBeans in each state (Normal , Warning , Critical , Fatal ), along with a color-coded bar. The length of colored bar indicates the number of MBeans in the corresponding state compared to the total number of MBeans.
Free Memory. The current free JVM memory, expressed as a percentage of the total allocated.
CPU Usage. The current average CPU usage.
Threads. The current number of threads.
GC. The period average garbage collection overhead expressed as a percentage for the selected time range.

MQ tile

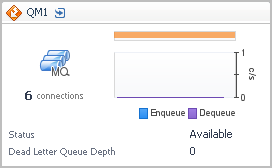
Use the MQ Tile to gather performance information about the state of queue transactions on an MQ Queue Manager monitored by the Foglight for IBM WebSphere MQ Server.

Topology Object Name: MQQueueManager

Number of Connections. The average number of queue manager connections.
Health History Bar. The color-coded bar represents the alarm state of the monitored component over the time range selected in the SOC. The color of the bar changes depending on the alarm state. Red indicates a Fatal state, orange indicates Critical, yellow means Warning, and green is the Normal state.
Enqueue/Dequeue. The plotted message enqueue and dequeue rates.
Status. The average queue status for the time range: available, unavailable, or unknown.
Dead Letter Queue Depth. The average depth of the dead letter (undeliverable messages) queue.

Oracle tile

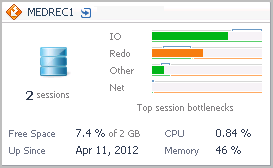
Use the Oracle Tile to gather performance information about the state of Oracle® database transactions monitored by Foglight for Oracle. This tile displays the current top used resources from the list below.

Topology Object Name: DBO_Instance

Sessions. The current average number of active sessions.

Top Session Bottlenecks. A breakdown of the health state of potential session bottleneck points by severity. The four top used resources from the list below are displayed on the tile.

Free Space. The amount of database storage space available, expressed as a percentage of the total available.
Up Since. The date the database was last restarted.
CPU. The average CPU usage for all Oracle® agents.
Memory. The average memory usage for all Oracle agents.

OS tiles

Use the OS Tiles to gather performance information about the state of Apache servers, application server hosts, Log Filter agents, or web servers. The OS Tiles require the Cartridge for Operating Systems.

For more information, see the following topics:

Related Documents

The document was helpful.

Select Rating

I easily found the information I needed.

Select Rating