|
2 |
Review overall performance in the Summary tab. |
|
• |
Controller Details. Displays the controller’s status, physical details, and parent device. |
|
• |
Charts. Displays the following metrics over the time period, if available: |
|
• |
Alarm Summary. Displays alarms on the controller. |
|
3 |
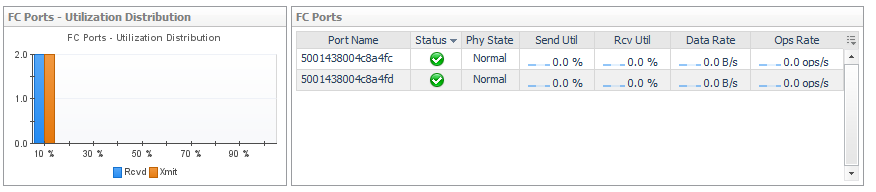
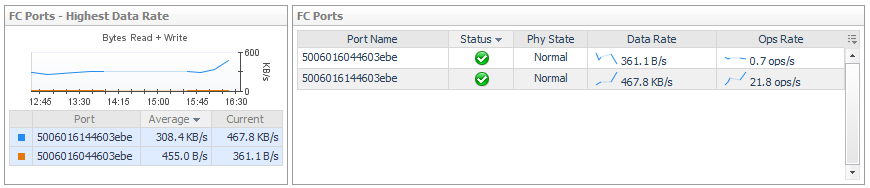
Review Port performance in the Port tab. |
|
• |
Port Details. List the ports, their status and physical state, and current values for Data Rate and Ops Rate. Click a |
|
2 |
Review overall performance in the Summary tab. |
|
• |
Details. Displays the directory’s status, physical details, and parent device. |
|
• |
Topology. Displays the connections from datastores to the selected directory. |
|
2 |
Review overall performance in the Summary tab. |
|
• |
Related Inventory. Displays a list of components from the perspective of the member (rather than the storage array). |
|
• |
Resource Utilization charts. Compares resources used by the member against resources used by the pool. |
|
• |
|
• |
Summary and Resource Information. Displays physical details about the member. |
|
• |
Alarm Summary. Displays alarms on the member. |
|
3 |
Click the Network tab. |
|
4 |
Click the Disks tab. |
|
2 |
Review overall performance in the Summary tab. |
|
• |
Details. Displays the port’s status, physical details, parent switch, parent fabric, VSAN (if applicable), and current values for Data Rate, Frame Rate, Link Error Rate, and Non-Link Error Rate. Click a |
|
• |
Charts. Charts plot the following metric pairs over the time period: |
|
• |
Alarm Summary. Displays alarms on the port. |
|
3 |
Click the Topology tab. |
|
• |
Switch-to-Switch Connectivity diagram. Displays the selected ISL port (left box) and its connection to another ISL port (right box). Click a port icon for details about the device connected to the port. |
|
• |
Topology Table (Inter-Switch Connections). Identifies all ISL port connections from this port’s parent switch to other switches in the fabric. |
|
• |
Basic Connectivity (table). Displays the ESX hosts and/or physical hosts connected to the selected N port through their host ports. An N port can have connections to multiple host ports using NPV technology. |
|
TIP: If hosts in the Host Name column are (unknown), you may be able to use dependency processing to infer the host names associated with the host ports. For instructions, see Inferring Physical-Host-to-Storage Relationships. |
|
• |
Basic Connectivity (diagram). Displays the selected N port (left box) and its connection to a filer or storage array port (right box). Click a port icon for details about the device connected to the port. |
|
• |
Select Host Port(s). Controls the set of hosts displayed in the Port Dependencies table. |
|
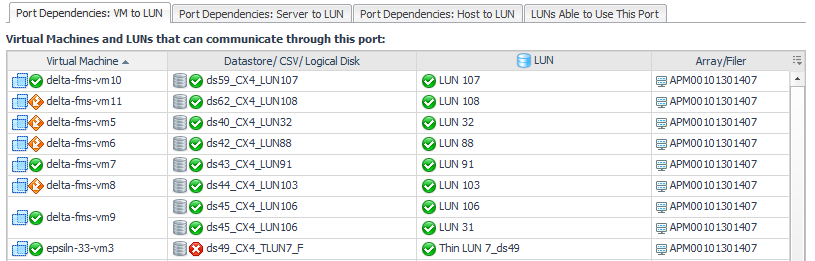
• |
Port Dependencies. On separate tabs, displays connections to LUNs (though the selected port) from virtual machines, ESX or Hyper-V servers, and physical hosts. If the selected port has problems or failures, the connected VMs or hosts may exhibit performance problems. |