
|
1 |
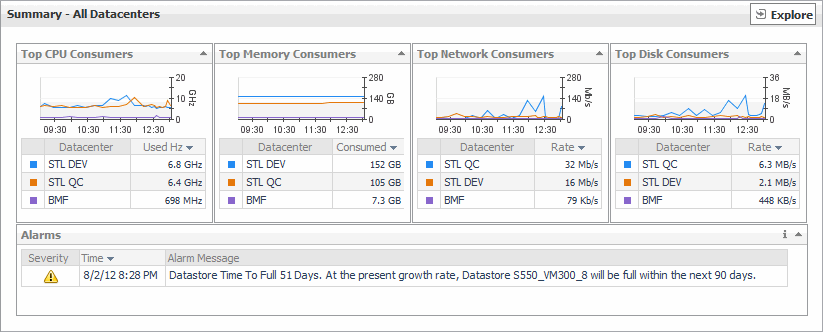
On the VMware Environment dashboard, on the Monitoring tab, in the Virtual Environment Overview, select the Servers tile. |
|
2 |
|
• |
| |||
| |||
| |||
 |
| |||
| |||
| |||
| |||
| |||
| |||
| |||
Figure 250. Alarms dialog box
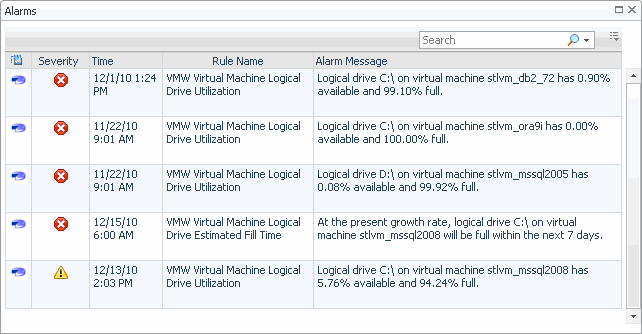 | |||
Figure 251. Clusters Inventory dwell
 | |||
Figure 252. Datacenters Inventory dwell
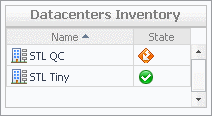 | |||
Figure 253. Datastores Inventory dwell
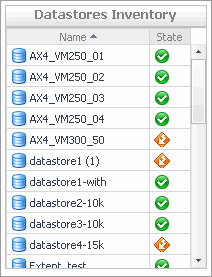 | |||
Figure 254. ESX Hosts Inventory dwell
 | |||
Figure 255. Resource Pools Inventory dwell
 | |||
Figure 256. Virtual Centers Inventory dwell
| |||
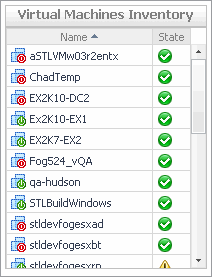
Figure 257. Virtual Machines Inventory dwell
 |
| |||
| |||
| |||
| |||
| |||
| |||
| |||
| |||
| |||
| |||
| |||
| |||
| |||
Figure 258. CPU Load dialog box
 | |||
Figure 259. CPU Utilization dialog box
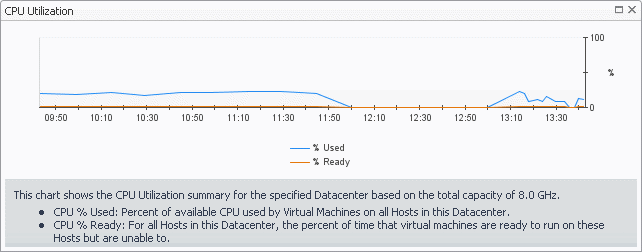 | |||
Figure 260. Disk I/O dialog box
 | |||
Figure 261. Disk Utilization dialog box
 | |||
Figure 262. Memory Utilization dialog box
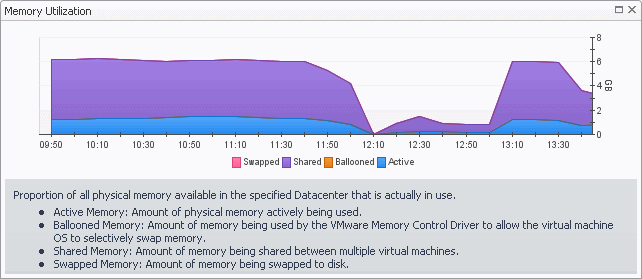 | |||
Figure 263. Network I/O dialog box
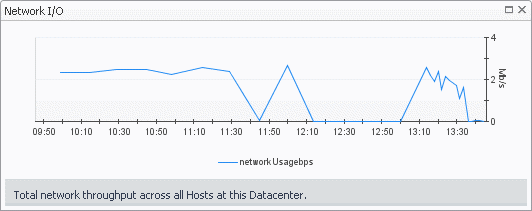 | |||
Figure 264. Network Utilization dialog box
 |
|
1 |
On the VMware Environment dashboard, on the Monitoring tab, in the Virtual Environment Overview, select the Datacenters tile. |
|
2 |
|
• |
| |||
| |||
| |||
| |||
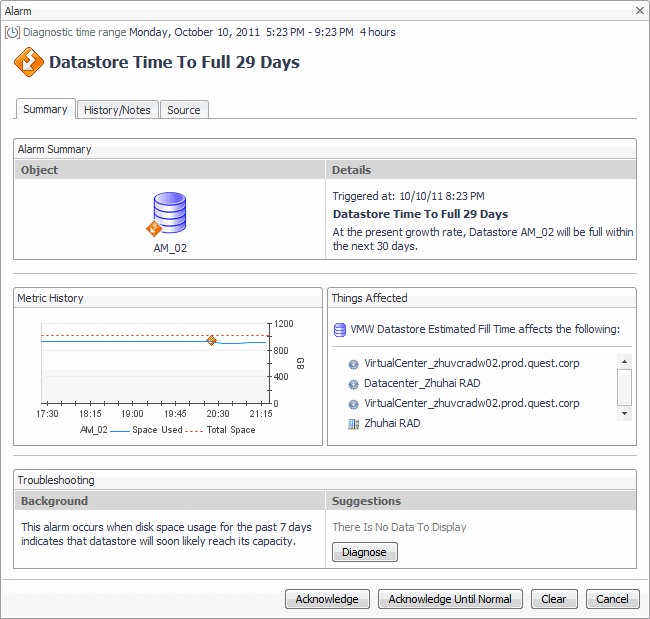
Figure 266. Alarm Created dialog box
 |
| |||
| |||
Figure 267. Top 3 Datacenters -CPU Used Hz dialog box
 |
| |||
| |||
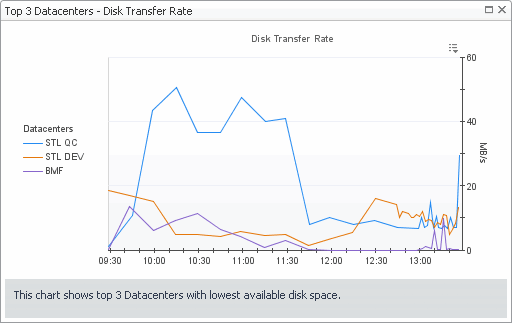
Figure 268. Top 3 Datacenters - Disk Transfer Rate dialog box
 | |||
| |||
| |||
Figure 269. Top 3 Datacenters - Memory Consumed dialog box
 | |||
| |||
| |||
Figure 270. Top 3 Datacenters - Network Transfer Rate dialog box
 | |||
|

|
• |
On the VMware Environment dashboard, on the Monitoring tab, in the Virtual Environment Overview, select the Datacenters tile. |
| |||
| |||
| |||
| |||
|
|
1 |
On the VMware Environment dashboard, on the Monitoring tab, in the Virtual Environment Overview, select the Datastores tile. |
|
2 |
|
• |
| |||
| |||
| |||
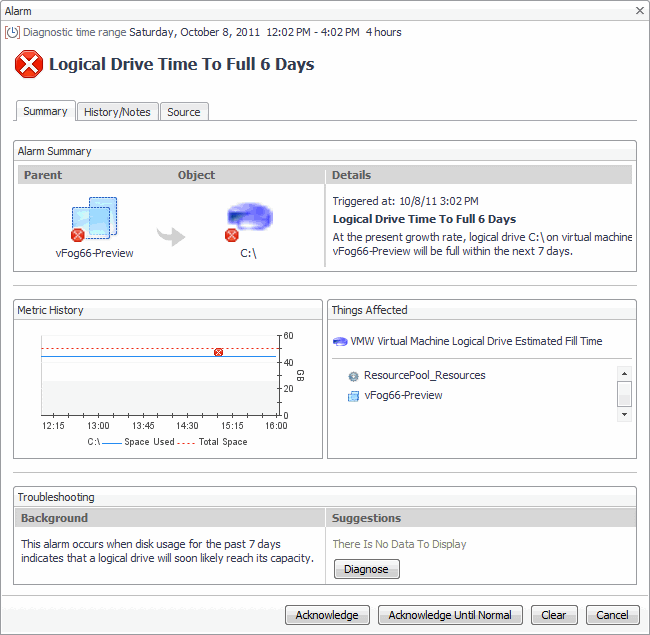
Figure 273. Alarm dialog box
|
| |||
| |||
| |||
| |||
| |||
| |||
Figure 274. Alarms dialog box
| |||
Figure 275. Clusters Inventory dwell
| |||
Figure 276. Datacenters Inventory dwell
| |||
Figure 277. Datastores Inventory dwell
| |||
Figure 278. Virtual Centers Inventory dwell
| |||
Figure 279. Virtual Machines Inventory dwell
|
| |||
| |||
| |||
| |||
| |||
| |||
| |||
| |||
| |||
| |||
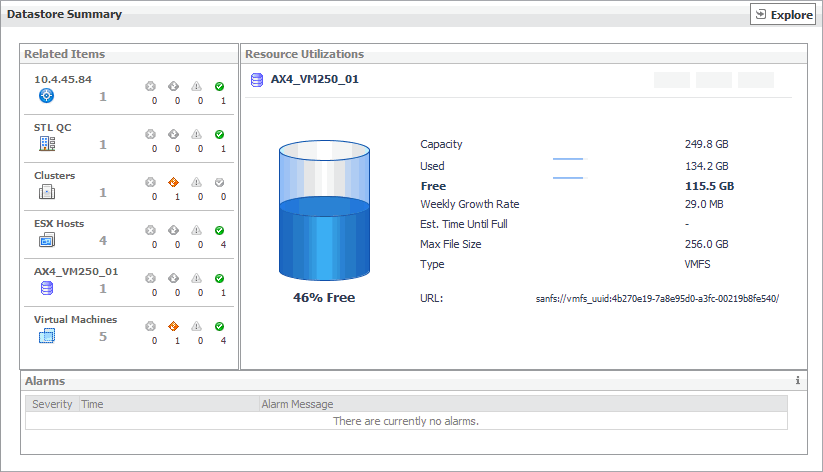
Figure 280. Storage Used dialog box
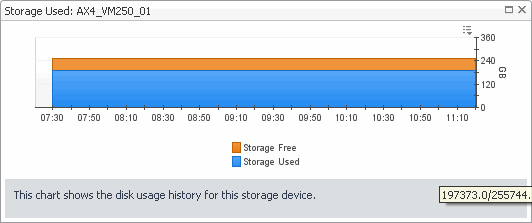 | |||
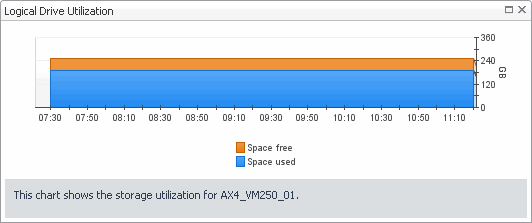
Figure 281. Logical Drive Utilization dialog box
 |
